From ecological maps to managed data
Sources · 1
1. Mary McEwen’s near-contemporary account supports the late-1985 ecological-GIS bridge: ecological region and district boundaries being digitised while the DSIR Science Mapping Unit began using Intergraph and the Biological Resources Centre developed a geographic biological-information concept. Chapter 9 owns the detailed early science lineage; Chapter 26 does not call this New Zealand’s first conservation GIS.
In late 1985 Mary McEwen encountered GIS while ecological region and district boundaries were being digitised and DSIR’s Science Mapping Unit was beginning to use an Intergraph system. The work sat inside a longer conservation tradition of field survey, species records, ecological classification and thematic mapping. The Biological Resources Centre was considering how a national Biological Resources Information System might organise and retrieve biological information geographically. At that stage GIS was still close to scientific mapping and database design rather than a service available across a conservation agency.
When the Department of Conservation was formed in 1987 it inherited more than land and staff. It inherited protected-area boundaries, ecological regions and districts, biological records, historic and archaeological information, huts and tracks, fire and pest records, maps from predecessor agencies and the different practices used to maintain them. Some information was national, some regional and some remained local to the office or specialist who had created it. The new department therefore had a geographic information problem long before it had a single national GIS.
The records also behaved differently. A reserve boundary could be surveyed or legally described, while the known range of a species might depend on observations collected over years. A hut was a physical asset with a location and condition, while a pest-control operation covered an area that could change between seasons. A track had a route, an operational status and maintenance history. Conservation information was spatial, but not all of it was fixed in the way a cadastral parcel or utility asset was fixed.
Early GIS work helped bring some of these traditions into common digital form, but the department remained geographically dispersed. Field centres and conservancies needed access to local information while Head Office needed national views. Computer capacity, network bandwidth and GIS skill varied between offices. The technical history that followed was therefore as much about distribution and maintenance as it was about analysis.
A department spread across the country
DOC’s organisational geography made centralisation difficult. Staff worked in field centres, area offices, conservancies, regional offices and Head Office, often far from the systems or specialists maintaining national datasets. Some users needed full desktop GIS. Others needed to find a reserve, print a map, inspect an asset or combine a few approved layers. A national system had to serve people who did not all have the same software, training or connection speed.
The information itself was distributed as well. Biological records might originate from scientific surveys. Asset information came from facilities and field operations. Protected areas and administrative boundaries changed through legal processes. Tracks and huts were maintained through operational programmes. External layers such as roads, cadastral information, topography and land cover came from other agencies or national datasets. The department needed ways to join these sources without treating every layer as if DOC owned and maintained it.
By the late 1990s and early 2000s the problem was no longer whether conservation work could use GIS. Local capability already existed. The harder problem was how to provide consistent access across a large organisation while keeping national data current and allowing regional staff to contribute information. That led first to the Biodiversity Information Platform and then to a wider National Enterprise GIS.
Building a biodiversity platform
Sources · 1
3. DOC Annual Report 2000/01 supports Biodiversity Information Platform development at conservancy and national levels and the planned Bay of Plenty pilot. The BIP-to-DOCgis transition is supported by DOC’s 2003 technical paper and Release II training material, which document ArcSDE, ArcGIS, ArcIMS, SQL Server, a national geodatabase, browser applications, links to business databases and field-device pathways. Planned and operational components remain distinguished.
DOC’s 2000/01 annual report described Biodiversity Information Platform development at both conservancy and national levels. A Bay of Plenty Conservancy pilot was planned for August 2001. The proposed intranet system would allow staff to select maps containing roads and tracks, combine them with land-cover and land-resource layers, identify mapped features, run database and graphical queries, and turn layers on or off. The design was intended to widen staff access to terrestrial and freshwater biodiversity information rather than leave spatial work with a small specialist group.
The platform provided maintained data and interactive services. National biological and asset databases were to be overlaid on geographic information and exposed through an interface that allowed staff to explore the relationship between records. That required common coordinates, agreed identifiers and enough metadata for users to understand the layers they were seeing. It also required a way to distinguish nationally maintained information from data being developed in a conservancy.
The Bay of Plenty pilot reflected the department’s distributed structure. A national system had to accommodate the different conservation workflows operating across Head Office, conservancies and field teams. Regional offices held much of the local knowledge needed to interpret or maintain the data. The enterprise system developed through both national programmes and conservancy work.
During the next two years the Biodiversity Information Platform was absorbed into a broader National Enterprise GIS. The name DOCgis was applied to the intranet and extranet application lineage. By 2003 the technical architecture had moved well beyond the original biodiversity portal proposal, with central databases, desktop GIS, browser applications and links to business systems all being treated as parts of the same environment.
DOCgis becomes a national system
Sources · 1
3. DOC Annual Report 2000/01 supports Biodiversity Information Platform development at conservancy and national levels and the planned Bay of Plenty pilot. The BIP-to-DOCgis transition is supported by DOC’s 2003 technical paper and Release II training material, which document ArcSDE, ArcGIS, ArcIMS, SQL Server, a national geodatabase, browser applications, links to business databases and field-device pathways. Planned and operational components remain distinguished.
A 2003 Department technical paper described an enterprise GIS designed for an organisation of roughly 2,000 staff distributed around the country. The architecture included Microsoft SQL Server, a national geodatabase, ArcSDE, ArcGIS desktop software and ArcIMS web applications. Existing business records could be spatially enabled through coordinates and identifiers rather than copied wholesale into the GIS. National spatial data were brought into a common geodatabase environment and served through several client types.
The design separated specialist production from general access. Trained GIS users could work with desktop tools and maintain data. Other staff could reach approved information through browser applications. This avoided the cost and support burden of installing full desktop GIS for everyone who occasionally needed a map or location query. It also reduced the number of uncontrolled copies created simply because somebody in another office needed access to the same layer.
The period technical record shows DOCgis HTML Version 1.0 already in the application lineage, a Version 2.0 milestone in June 2003 and a Java-client milestone planned for August. The surviving Release II training guide later that year describes an operational ArcIMS portal with national spatial and business databases behind it. It credits the Department’s Science and Technology & Information Services Division, Information Management Unit, Spatial Information Management, Head Office.
Source notes
The individual roster for the original 2000/01 to August 2003 development remains incomplete, so the system is better credited to the documented departmental teams than reconstructed around one person.
That organisational credit also fits the way the system had to operate. Conservancy Information Management Units supplied local GIS capability and support, while national teams maintained enterprise components. Different staff had different skill levels and responsibilities for spatial information entering the national environment. A system intended for field centres and conservancies could not survive as a Head Office application with no local stewardship.
The browser reaches the field office
The 2003 training guide shows what enterprise GIS looked like before broadband could be assumed. DOCgis was centrally hosted, but many users reached it from offices with slow connections and older computers. The interface and support material had to account for that. Web delivery reduced the software burden on the client machine, but it did not remove the limitations of the departmental network.
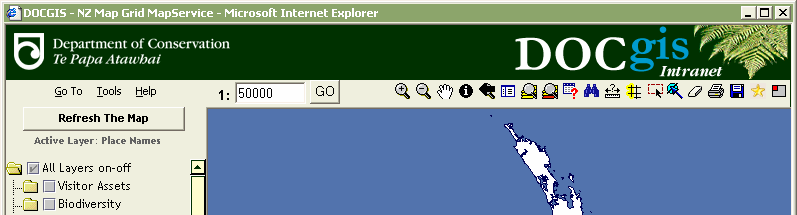
Image source · R12-V05
Department of Conservation, DOCgis Training Guide, Intranet Edition, Release II, 2003, p.12.
- Date
- 2003.0
- Creator / photographer
- Department of Conservation
- Repository
- NZ GIS History project Drive / Department of Conservation
- Catalogue / reference
- DOCgis Training Guide Intranet Edition, Release II; Drive ID 1XRCd1GZyEz1mN92dQwD9HiDFrJPX_Hr2
- Copyright / licence
- The 2003 guide explicitly identifies Department of Conservation production. Current DOC web-content terms are generally CC BY 4.0, but item-level application to this 2003 internal training publication and embedded DOC branding/logo has not been confirmed.
For many staff the browser changed the way GIS appeared in daily work. A user did not need to open a professional GIS package, locate the correct project files and understand every dataset before answering a straightforward location question. The portal exposed selected layers and tools through a controlled interface. Staff could view conservation areas, assets, roads, tracks and other information from the same national environment used by specialist GIS staff.
The system also connected spatial information with operational databases. A mapped feature could lead to records maintained elsewhere in the department. That was useful for assets because a hut, track structure or other facility had both a position and a business record. The same pattern applied to biodiversity and management information, where location was one part of a larger record rather than the whole record.
Field-device integration was already part of the architecture being discussed in 2003. GPS, ArcPad and Windows CE devices appeared in the technical design as ways to connect field activity with the national system. The fuller mobile-GIS history belongs later in the book, but the conservation case records an early organisational requirement: information collected in the field had to return to the same databases used for planning and reporting.
DOCgis after the 2003 releases
Sources · 1
DOC's annual report, 2003 technical paper and training guide support the Biodiversity Information Platform, National Enterprise GIS and DOCgis chronology. The initial releases are credited to the documented departmental teams; the full individual roster is not established, and Duane Wilkins's documented development work is post-October 2003.
DOCgis grew from work already underway in the Department of Conservation’s 2000/01 Biodiversity Information Platform. A Bay of Plenty Conservancy pilot was planned for August 2001. Over the next two years that work was absorbed into a broader National Enterprise GIS, with DOCgis used for the intranet and extranet application lineage.
Sources
- R12-S01 · Department of Conservation Annual Report for the year ended 30 June 2001, Biodiversity Information Platform Project section
- R12-S02 · Department of Conservation, Managing Conservation Enterprise Systems: National Enterprise GIS Implementation for Conservation Management, Esri International User Conference 2003, Paper 1048
- R12-S03 · Department of Conservation, DOCgis Training Guide, Intranet Edition, 2003, Release II
- R22-S03 · Surviving first-party historical career record for Duane Wilkins
- DR-S147 · Department of Conservation, 'GIS? What’s GIS?' conservation blog
- DR-S148 · New Zealand Conservation Authority public papers, June 2015, reproduced DOCgis map print
By 2003 the architecture included Microsoft SQL Server, a national geodatabase, ArcSDE, ArcGIS desktop software and ArcIMS web applications. The design linked spatial information with operational business databases and supported GPS, ArcPad and Windows CE field workflows. Specialist GIS users maintained and analysed data while a much larger group of staff used centrally hosted browser applications.
The surviving technical record documents DOCgis HTML Version 1.0, a Version 2.0 milestone in June 2003 and a Java-client milestone planned for August. The Release II training environment shows why the browser mattered: staff in distributed offices, including sites with older computers and slow connections, could reach centrally maintained information without installing a full GIS workstation.
The initial releases are best credited to the documented departmental teams: Science and Technology & Information Services Division, Information Management Unit, Spatial Information Management, Head Office, supported by conservancy Information Management Units. The complete initial developer roster has not been recovered. Duane Wilkins is documented in continuing post-October-2003 enterprise-GIS development involving ArcSDE, ArcIMS, procedures, training, automated map production and online mapping; that later work should not be backdated into the initial June or August releases.
DOC publicly described DOCgis as part of an organisation-wide national GIS on 24 August 2009. A DOCgis map print dated 12 February 2013, later reproduced in official New Zealand Conservation Authority papers, provides further continuity evidence. The 2003 DOCgis interface image is deliberately omitted from this build because its public reuse position remains unresolved.
Maintaining conservation information
Sources · 1
5. The 2015 connected DOC presentation supports later operational examples only at that date, including Treaty settlement material, Te Araroa, Catchpool Valley, functional-location identifiers, assets/boundaries and rapid map requests. These examples are not projected back to 2003.
Once a national GIS existed, data maintenance became continuing work. Protected-area boundaries changed through acquisitions, disposals, classifications and settlement processes. Tracks and facilities were built, closed, relocated or renamed. Pest-control operations and fire histories changed from year to year. Biological observations accumulated, but older records did not necessarily lose value simply because a newer survey existed.
The department therefore needed different maintenance rules for different datasets. A legal boundary required a controlled source and date. An asset record needed an identifier that remained consistent across mapping and operational systems. A species observation needed provenance, observation date and often a measure of uncertainty. A pest-control polygon needed enough context to distinguish a planned operation from one that had been completed.
These distinctions limited how far a generic enterprise model could simplify conservation information. Putting layers into one geodatabase did not make them equivalent. The work still depended on subject specialists, field staff and information managers who understood what each feature represented and how it should be updated. GIS provided the shared geographic structure, while the authority for an individual record remained with the business process or scientific programme that created it.
By 2015 the internal DOCgis environment was still supporting a broad set of ordinary tasks. A surviving staff presentation from that year includes Treaty settlement material, Te Araroa, asset and boundary display, locating places such as Catchpool Valley and use of functional-location identifiers. One slide poses a practical request for a map of Wairau Lagoon for a meeting in thirty minutes. Staff used GIS for routine conservation tasks.
DOC described the organisation-wide role of GIS publicly on 24 August 2009. Its conservation blog estimated that almost 90 per cent of the information collected by the department had a geospatial aspect, and explained how specialists in conservancy offices contributed local information to a national system. Readers were directed to interactive DOCgis maps. A DOCgis print dated 12 February 2013, later included in New Zealand Conservation Authority public papers, shows the system continuing to support biodiversity, assets, permissions, conservation units and other operational information. These records place DOCgis within the department’s continuing work a decade after the early releases.
Sources
A national picture of land cover
Sources · 1
6. LCDB chronology is supported by the Motu/LCDB records: LCDB1 completed in 2000 from summer 1996/97 SPOT imagery, and LCDB2 released in July 2004 using summer 2001/02 Landsat 7 imagery with checking/correction and change information. The process is not described as fully automatic classification.
While DOC was building enterprise access, New Zealand was also creating a different kind of environmental spatial record. The first Land Cover Database was completed in 2000 using SPOT satellite imagery acquired during the summer of 1996/97. It classified land cover across mainland New Zealand, near-shore islands and the Chatham Islands. The date of the imagery and the date of the finished database need to remain separate because the product required classification, checking and correction after image acquisition.
LCDB converted imagery into a maintained thematic GIS dataset. Land-cover classes had to be interpreted, delineated, checked and stored consistently across the country. The database could then be used without every organisation repeating the classification work from the original imagery. For environmental agencies and researchers, that created a common national reference for questions about forest, scrub, grassland, urban cover and other land-cover types.
LCDB2 was released in July 2004 using Landsat 7 ETM+ imagery from summer 2001/02. During its production the earlier LCDB1 classifications were checked and corrected, and the two epochs could be used to identify changes between the late 1990s and early 2000s. The product was therefore both a new national snapshot and a revision of the earlier database. That quality-control step is part of the history because repeated national datasets inherit errors as readily as they inherit useful features.
Later versions extended the time series. Users could compare land cover across several periods rather than treat one map as permanent. That supported environmental reporting, land-use analysis and research into change. The imagery source changed over time, but the durable object for many GIS users was the classified national database, not the raw satellite scene.
From image to environmental record
LCDB also records a change in the relationship between remote sensing and GIS. Satellite imagery supplied the observation, while the database supplied the categories and geometry that could be joined with other environmental information. A user interested in land-cover change did not need to become an image-processing specialist. The classified result could be combined with catchments, soils, protected areas or other layers in an ordinary GIS workflow.
That separation allowed LCDB to move between agencies and applications. The dataset could support national reporting, regional analysis or research using the same class structure. It could also be criticised and corrected through later versions. Classification choices and imagery dates affected the national dataset’s account of each place.
The wider environmental-data landscape developed along similar lines. Land-resource information created in earlier decades moved into newer GIS and web-distribution environments. Soil, river, wetland, biodiversity and hazard datasets were maintained by research organisations and councils. Chapter 9 follows the scientific origins of many of these systems and Chapter 33 follows later open access. Here they form the supporting data environment in which conservation organisations increasingly worked.
Regional councils had their own statutory and operational reasons to maintain environmental geography. Catchments, consent locations, water takes, flood areas, soils, erosion, coastal features and monitoring sites all required spatial records. The Resource Management Act 1991 increased the amount of environmental planning and monitoring carried out by councils, but it arrived alongside local-government restructuring, desktop GIS, national datasets and existing catchment-management work.
Source notes
The historical record does not support treating the Act as a single nationwide cause of GIS adoption.
A plan for each farm
Sources · 1
7. Taranaki Regional Council material supports adoption of the Riparian Implementation Strategy in March 1993 and the GIS-based plan workflow from 2001. The council’s retrospective programme history supplies the reported production and time figures, including 279 plans during 1993–2001, more than 2,000 during 2001–2011 and plan preparation falling from about three days to one day. These remain council-reported figures.
Taranaki provides a more concrete view of GIS inside an environmental programme. The Taranaki Regional Council adopted its Management of Riparian Margins implementation strategy in March 1993. The programme worked with landowners to fence and plant stream margins, particularly across the intensively farmed ring plain. Early property plans were prepared without the later GIS workflow and required substantial staff time.
The council’s own programme history records GIS-based riparian plan preparation from 2001. Land-management officers walked individual properties, assessed fencing and planting needs and produced property-specific plans. The A3 plan combined an aerial map with GIS layers showing recommended work and tables covering timing, costs and suitable plant species. GIS therefore sat inside a face-to-face land-management process rather than replacing field inspection.
The council reported a sharp change in production after the GIS workflow was introduced. From 1993 to 2001 it had prepared 279 riparian plans. Between 2001 and 2011 it prepared more than 2,000. The same retrospective account says average plan-preparation time fell from about three days to one day, giving the council capacity to prepare roughly 350 plans a year. The council reported these improvements in its environmental workflow.
The changes also supported later updates and related work. Land-management officers revisited farms, recorded implemented fencing and planting and updated progress. GIS allowed the council to report implementation at property, catchment and regional scales. The same database could therefore support the landowner conversation, annual follow-up and wider programme reporting.
The later programme record adds some of the technical and human detail that usually disappears from summaries like this. In a 2011 conference presentation, Taranaki Regional Council manager Mike Nield described the GIS application as a joint development with Explorer Graphics, using Esri technology and delivered as an ArcGIS/ArcView ArcMap extension called the Land Management Application. Land-management officers worked through an LMA toolbar and menu while plan status could also be reported through the corporate intranet GIS. The council's November 2011 programme booklet puts an actual practitioner into the picture as well: GIS officer Melanie Candy is photographed at her desk updating a riparian plan, surrounded by aerial mapping on screen and paper.
Source notes
Those 2011 sources document the mature workflow, not the identity of the original 2001-02 implementation team, which remains to be recovered.
The Taranaki case also puts staff work back into the history. A council publication includes a photograph of GIS officer Melanie Candy updating a riparian plan, while other images show land-management officers working with farmers. The workflow depended on both roles. The GIS officer maintained and produced the spatial information; the field officer supplied observations and worked through the recommendations with the property owner.
Environmental GIS at property scale
The riparian programme differed from a general council property viewer because the map was part of an intervention. A line along a stream could represent proposed fencing. A polygon or annotation could represent a planting recommendation. Later field visits changed the record from proposed work to implemented work. The data therefore tracked a management process over time.
That created an environmental record capable of being aggregated without losing the property detail from which it came. The council could count kilometres fenced or areas planted, examine progress within a catchment and identify properties where work remained. The map was no longer just an illustration in a farm plan. It was also a structured record used to manage a regional programme.
The workflow shows why regional environmental GIS became durable. Environmental work is repetitive. Monitoring sites are revisited, consents are renewed, plans are updated, river conditions are measured and land-management programmes return to the same properties. A GIS that preserves the previous record reduces the need to reconstruct geography each time the programme comes around again.
It also creates a history of change. That can be useful scientifically and administratively, but only if dates and status are retained. A current riparian layer that overwrites all previous states may be adequate for today’s work but poor for evaluating how the programme developed. Environmental GIS therefore benefits from the same version and provenance disciplines encountered elsewhere in the book, even when the subject is a streambank rather than a cadastral parcel or electricity network.
Sensitive conservation data
Conservation GIS also carried access restrictions that were less visible in ordinary mapping projects. A threatened plant or nesting site can become more vulnerable if a precise location is published indiscriminately. Archaeological records may need access controls or generalisation. Operational information about pest control, fire response or infrastructure can also have reasons for restricted circulation.
A national enterprise system made these decisions harder to avoid. When information was stored on a specialist’s computer or in a local filing system, access was limited by inconvenience. Once the same record could be served through a browser to staff across the country, permissions had to be deliberate. Some users needed precise locations, while others needed only a general indication that a sensitive feature was present.
Māori authority over cultural information raised additional questions of governance. Cultural locations may involve collective rights, tikanga and decisions about who has authority to share knowledge. Environmental sensitivity can overlap with those concerns, but threatened-species protection, archaeological restrictions and Māori data governance have different sources of authority. A mature GIS environment had to handle those differences rather than assume that every location should become open simply because it was digital.
Historical conservation maps can contain species locations, archaeological sites and other information held under controlled access. Publication and reuse of those records depend on the permissions attached to the data. An account of a protected information system can describe its functions while respecting those restrictions.
Iwi resource-management work developed its own approaches to holding and using geographic information. Garth Harmsworth, Mick Park and Dean Walker documented a Motueka case in 2005, with Park and Walker affiliated to the Motueka Iwi Resource Management Advisory Komiti at Te Awhina Marae. Their account placed iwi and hapū information needs, capability and control alongside the technical work of building a GIS. Maps could support environmental decisions while access to culturally sensitive information remained governed by the people responsible for it.
Conservation GIS beyond government
One volunteer experiment had already pushed well beyond desktop mapping. Mike Peters later recalled that the New Zealand Ecological Restoration Network's Pipi 4 system, developed from 2005, gained GIS capability with help from Parker Jones at Eagle Technology and an Esri Conservation GIS grant. Peters said a live Pipi demonstration at a Wellington NZ Esri User Conference was followed by roughly NZ$600,000 of donated Esri software, including ArcIMS and ArcSDE, arriving in boxes on a pallet. Pipi then hosted customised web maps for conservation projects ranging from small sites to catchment-scale work. Community conservation groups were developing web GIS before later support networks were established.
Source notes
The surviving account is retrospective and does not securely identify the conference year, so the grant story remains Peters' recollection rather than a reconstructed conference programme.
By the 2010s conservation GIS was no longer confined to government departments, councils and research organisations. NZ GIS in Conservation was established in 2012 as a registered not-for-profit to support the use of GIS by volunteer conservation groups and iwi working in conservation around New Zealand. By then, desktop GIS, national datasets and web tools were becoming practical for smaller conservation organisations as well as large agencies.
Volunteer groups had often worked with highly local information: trap lines, restoration sites, pest observations, planting areas, tracks and property boundaries. Earlier GIS systems could be too expensive or technically demanding for a small community organisation to maintain. Desktop software became easier to obtain, national datasets became more accessible and web mapping reduced the amount of local infrastructure required. Specialist support could then be directed at the conservation task rather than at acquiring a full enterprise GIS.
The groups still faced the same basic data questions as larger organisations. Someone had to decide how features were named, where the current copy lived, how field observations were checked and whether sensitive locations could be shared. Small scale did not remove the need for disciplined information management. It did make the social side of the work more visible because the person collecting the field observation might also be the person maintaining the map.
Community conservation also widened the range of organisations that could contribute geographic information. Government agencies remained responsible for national datasets and statutory functions, but volunteer groups could collect detailed local records that no national programme could capture at the same frequency. GIS provided a practical way to combine those local observations with wider environmental context when governance and data-sharing arrangements allowed it.
Environmental information as infrastructure
By the 2010s conservation and environmental GIS in New Zealand covered a wide span of work. DOC maintained national spatial and business information for staff distributed around the country. Regional councils used GIS to manage property-level environmental programmes and monitor their progress across catchments. National datasets such as LCDB supplied repeatable environmental context. Research organisations maintained other scientific layers, while community groups increasingly used the same shared data and software environment for local conservation projects.
Agencies continued maintaining separate environmental GIS systems. DOC, councils, research institutes and community organisations had different responsibilities and different data. They did, however, increasingly depend on common reference systems, national base data, maintained identifiers and ways to exchange spatial information. A conservation officer could work with agency data, national land cover and external reference layers in the same task without needing those records to be owned by the same organisation.
By this point, environmental records were expected to persist from one decision cycle to the next. A riparian plan could be revisited. A land-cover classification could be compared with a later epoch. A protected-area or asset record could be updated rather than redrawn from a paper map. A browser user in a remote office could reach data maintained somewhere else in the organisation. GIS became part of the record-keeping system for conservation work.
That record still depended on people. Field staff collected observations, land-management officers worked with landowners, scientists defined classifications, database and GIS staff maintained national layers, and local users reported corrections when the screen disagreed with the landscape. Enterprise architecture made the information easier to distribute, but it did not remove the labour required to keep it credible.
Population and health work used many of the same geographic techniques, but the data behaved differently. Disease events, population denominators, service access and community vulnerability brought privacy, statistical geography and uncertain addresses into the GIS. By the early 2000s New Zealand public-health organisations were already combining those problems with automated mapping, national surveillance and web delivery.