Three dimensional mapping
Sources · 1
1. Chapter 39 begins with integrated three-dimensional use rather than retelling LiDAR or UAV acquisition. Elevation models, LiDAR point clouds, photogrammetric surfaces, buildings and engineering models become inputs that can be combined in a 3D information environment.
For much of GIS history, height was present without making GIS fully three-dimensional. Contours carried elevation across topographic maps. Digital elevation models stored a height value across a surface. Surveyors measured levels, photogrammetrists reconstructed terrain and engineers worked with sections and profiles. Even when a GIS displayed terrain in perspective, much of the information around it still behaved as flat points, lines and polygons draped over a surface.
By the 1990s that arrangement was already becoming more sophisticated. New Zealand organisations had digital terrain, imagery and forest information that could be combined into convincing perspective views. At GeoComputation '97 and SIRC '97 in Dunedin, Alan Thorn, Terry Daniel and Brian Orland described using GIS data to visualise New Zealand plantation-forest management scenarios. ARC/INFO supplied geographic and terrain information, while SmartForest II, image-processing tools and powerful workstations helped produce photorealistic scenes that could be assessed by managers and the public.
The images helped users understand the modelled space. Forest management under the Resource Management Act could involve arguments about what harvesting or planting would look like from real places, and a perspective scene could communicate effects that a contour map or coded stand polygon did not make obvious. The work demonstrated how GIS could feed a three-dimensional visual environment well before modern web scenes and digital twins. It also exposed a distinction that would become increasingly relevant: a view can be three-dimensional without the underlying information system being a general three-dimensional GIS.
Visualisation and modelling
Sources · 1
5. A visually detailed model is not automatically current, authoritative or interoperable. The chapter retains distinctions between visualisation, 3D GIS, engineering/BIM models, city models and digital twins where the source material supports them.
New Zealand GIS researchers were already confronting that distinction by the end of the decade. At the 1999 SIRC colloquium in Dunedin, Yuxiao Li, Peter Whigham, George Benwell and Nick Mulgan presented a paper on the design of a general-purpose three-dimensional spatial information system. The title alone marks a change from rendering terrain towards thinking about how three-dimensional objects should actually be represented, stored and handled. A photographically convincing scene and a spatial database capable of maintaining volumes, relationships and geometry are related problems, but they are not the same problem.
Two-dimensional GIS had developed around familiar abstractions. A road could be a line, a property a polygon and a building a footprint. Height might sit in an attribute or a surface underneath those features. Once the third dimension becomes part of the object itself, the data becomes more complicated. A tunnel may pass beneath a road without intersecting it. Two legal interests may occupy different vertical spaces above the same patch of ground. A pipe may cross another pipe in plan while remaining safely separated in height.
Three-dimensional information required data structures, relationships and analytical methods. Geometry needed to describe surfaces or volumes. Relationships had to preserve which objects were above, below, inside or connected to others. Coordinates needed a reliable vertical reference as well as a horizontal one. Software also had to draw and query much larger datasets without turning ordinary workstations into expensive heaters.
Terrain becomes data
Sources · 1
1. Chapter 39 begins with integrated three-dimensional use rather than retelling LiDAR or UAV acquisition. Elevation models, LiDAR point clouds, photogrammetric surfaces, buildings and engineering models become inputs that can be combined in a 3D information environment.
Terrain was one of the first kinds of 3D information to become routine because GIS already had strong reasons to analyse elevation. A digital elevation model could support slope, aspect, drainage, viewsheds, profiles and earthwork calculations without anyone building a photorealistic world. LiDAR and national elevation datasets provided dense measured surfaces, while UAV photogrammetry produced detailed local models. The 3D story develops once those observations enter the information environment and users start asking what they can be combined with.
A terrain surface becomes more useful when it shares coordinates with roads, parcels, rivers, buildings and infrastructure. The surface may explain where water will flow, how a road cuts across a hillside or whether a proposed structure will be visible from another location. It can also provide the base on which other three-dimensional objects are positioned. These uses give the third dimension a persistent analytical role alongside its visual one.
As elevation data became denser, the form of the data changed as well. Instead of starting with a relatively tidy grid or triangulated surface, practitioners increasingly received millions or billions of measured points. Airborne LiDAR, terrestrial laser scanners and later UAV photogrammetry all contributed to this change. The point cloud became a common intermediate form between measurement and model.
Point clouds become normal
Sources · 1
1. Chapter 39 begins with integrated three-dimensional use rather than retelling LiDAR or UAV acquisition. Elevation models, LiDAR point clouds, photogrammetric surfaces, buildings and engineering models become inputs that can be combined in a 3D information environment.
A point cloud can look like a three-dimensional model when viewed on screen. Rotate it and a building, cliff or riverbank appears. Zoom closer and individual observations become visible. Yet the cloud may contain little explicit understanding of what each group of points represents. Turning dense measurements into useful spatial information requires classification, filtering, surfaces, object extraction or links to other datasets. It is possible to have billions of beautifully measured points and still be missing the one thing the user actually asked for: a usable answer.
New Zealand surveying provides a clear professional transition. Mike Pinkerton's 2010 FIG paper, Terrestrial Laser Scanning for Mainstream Land Surveying, treated laser scanning as a technique moving beyond specialist novelty into ordinary survey practice. The instrument could rapidly collect dense three-dimensional observations of structures and terrain, but the surveying task still required control, registration, checking and a deliverable suited to the client. The scanner increased the quantity of measurement; it did not remove the need to decide what the measurements meant.
The Rees River research published in 2014 pushed density even further. Richard Williams, James Brasington, Damià Vericat and Murray Hicks combined mobile terrestrial laser scanning with aerial photography and optical bathymetric mapping over a braided-river reach. Their work assembled more than five billion survey observations into detailed terrain information. The scale is useful because it shows why 3D GIS was partly a data-management problem: once capture technology could produce billions of points, simply possessing the data was not the same as being able to use it well.
Point clouds also blurred the boundary between GIS, surveying and engineering software. A surveyor might register scans in specialist software, derive a surface, export selected objects and then place the results into GIS. An engineer might use the same observations in CAD or a design system. The growing question concerned how geometry, coordinates and meaning survived as information moved between disciplines and systems.
A cadastre with volume
Property rights expose the limits of flat spatial models particularly clearly. New Zealand's digital cadastre was built around a powerful two-dimensional representation of parcels and survey geometry. That worked well for most land, but cities increasingly contained apartments, tunnels, easements, shared access, stacked units and rights that occupied different vertical spaces. A plan could describe those arrangements, but the database did not necessarily hold them as explicit three-dimensional objects.
From 2014 onward a well-documented New Zealand research lineage examined what a 3D digital cadastre would require. Trent Gulliver and Anselm Haanen presented Developing a Three-Dimensional Digital Cadastral System for New Zealand at the FIG Congress in 2014. Gulliver's University of Canterbury master's research followed in 2015, and a 2016 paper by Gulliver, Haanen and Mark Goodin set out a pathway towards a 3D digital cadastre for New Zealand by 2021. The date was a proposed target.
The problem was deeper than extruding parcel polygons upward. Legal space may be bounded by floors, ceilings, sloping surfaces or surveyed heights. Adjacent rights need consistent topology and identifiers. Survey rules, title relationships and the authoritative cadastral record all have to agree with the geometry. A colourful three-dimensional block model can show an apartment stack, but a national cadastre has to maintain what each volume legally means.
Later LINZ material confirms that this remained an active transition rather than a finished historical event. The agency's 2023-27 strategic intentions said the cadastre already held significant information depicting three-dimensional property ownership, while representation remained available through two-dimensional plan images. From 1 July 2024, NZVD2016 became the official vertical datum for cadastral surveys containing reduced levels, with LINZ guidance explicitly linking the requirement to future conversion to a 3D cadastre. By the end of 2025 the institutional groundwork had advanced, but it would be wrong to describe New Zealand as operating a complete nationwide 3D cadastre.
Infrastructure in three dimensions
Infrastructure creates similar problems for different reasons. Pipes, cables, bridges, retaining structures and roads occupy real volumes and often pass above or below one another. A two-dimensional network can represent connectivity, but design, construction and maintenance may require levels, clearances, depths and three-dimensional geometry. Large engineering programmes therefore became places where 3D information had to move between surveyors, designers, contractors and GIS teams.
Christchurch's post-earthquake rebuild provides a well-documented operational case. Chris Scott's 2016 FIG paper described the scale of surveying within the Stronger Christchurch Infrastructure Rebuild Team. Around 150 surveyors from sixteen consultancies contributed roughly 200,000 survey hours. The programme used a federated digital delivery environment and included intelligent three-dimensional drainage strings among the information passed through the rebuild workflow.
Those drainage strings were more than attractive lines drawn in perspective. Their vertical position affected gradients, connections and constructability. Survey information had to move into engineering design, then back into records of what had actually been built. The work shows why 3D became practical infrastructure information: an underground pipe has a horizontal route, but its depth and gradient can determine whether the network functions.
The SCIRT example also demonstrates that 3D adoption was organisational. Hundreds of people and multiple consultancies needed common controls, naming, coordinates and delivery conventions. A technically excellent model that could not be exchanged across the programme was of limited value. Three-dimensional information therefore increased the importance of standards and governance rather than making those older GIS concerns disappear.
When height changes the answer
Three dimensions become worth the effort when the answer changes because two features occupy different heights. This is obvious in drainage, where pipe invert levels and gradients determine flow, but the same principle appears in roads, bridges, tunnels, retaining structures and buildings. In a flat view two features can appear to intersect even though one passes safely above the other. The third coordinate resolves relationships that a plan view can only describe indirectly.
The analytical consequences extend beyond engineering. A terrain model can support visibility analysis because height determines whether one location can see another. A building model can be used to test shadow or height effects because the vertical form is explicit. A quarry or earthworks surface can be compared with an earlier survey to calculate cut, fill or volume. A subsurface right can be distinguished from the parcel above it because the legal space has vertical limits rather than merely a footprint.
Structured 3D information becomes more useful than a rendered scene when the objects can be identified, queried and related. A user should be able to identify an object, retrieve its attributes and understand how it relates to neighbouring objects. A pipe needs an asset identifier and network relationship as well as a three-dimensional line. A building may need a link to an address, parcel or asset record. Cadastral volumes required legally defined boundaries and heights.
The difference also affects change through time. If a model is built from objects with persistent identifiers, an organisation can record that one pipe was replaced, one building altered or one survey superseded while retaining the earlier state. If the system stores only a visual mesh, the same change may require rebuilding a large scene without a clear relationship to the records it represents. Three-dimensional GIS therefore inherits the old GIS problem of deciding which objects are authoritative and how their history is preserved.
A third coordinate needs discipline
Sources · 1
2. Coordinate and height-reference issues remain governed by the national geodetic framework established earlier in the book. The 3D chapter uses those issues only to show why horizontal and vertical reference systems continue to affect later model integration.
Working in three dimensions also exposes coordinate problems that can remain hidden in ordinary map use. Horizontal position in New Zealand is commonly expressed through NZGD2000 and NZTM2000, but elevation depends on the vertical reference used by the survey or dataset. Engineering projects may use local benchmarks or project grids. BIM models often begin from a local building origin chosen for design convenience rather than a national geodetic coordinate.
A model can look perfectly aligned inside its own software and still be wrong when combined with another dataset. A building shifted a metre horizontally may be obvious against an orthophoto, but a height mismatch can be harder to notice until two surfaces, floors or pipes are compared. Differences between ellipsoidal heights, orthometric heights and local datums can therefore become operational rather than academic. The national reference framework therefore continued to affect 3D GIS practice long after its establishment.
The move to NZVD2016 in cadastral surveying is one example of this longer dependency. A future 3D cadastre needs legal heights that can be compared consistently rather than a collection of isolated local references. Infrastructure integration has the same need. A drainage network, road design and building model cannot be confidently combined if their elevations refer to different surfaces or benchmarks and nobody records the distinction.
For practitioners this changed quality assurance. Checking whether a layer was in the right projection was no longer enough. Teams also had to ask what the Z values represented, which vertical datum or benchmark was used, whether heights were measured or modelled and whether the geometry had been transformed correctly. Three dimensions added another coordinate, but also another way for apparently precise data to disagree.
Digital Auckland
A city model provided a different kind of 3D environment. In 2011 Auckland Council commissioned Nextspace to create the Digital Auckland 3D city model. Auckland Transport evidence prepared in 2013 for the City Rail Link described the model as merging information from multiple sources and being updated from time to time. It had already been used to visualise plans for Auckland's future urban environment.
For the City Rail Link, Auckland Transport commissioned Nextspace to build a construction-sequence visualisation for the Albert Street section within the wider Digital Auckland environment. The proposed underground railway and its construction stages could be placed against the existing city rather than shown as isolated engineering drawings. That made the model useful as a communication and planning device. It also brought together geography above and below the ground, a recurring problem in dense urban areas.
Digital Auckland integrated city information in a three-dimensional model. Contemporary council reporting in 2014 still described Council and its council-controlled organisations as investigating a digital data and modelling tool that could collate information about above- and below-ground infrastructure, with a business case being prepared. Later New Zealand research described Digital Auckland as a tool for integrating and managing information from multiple custodians while ownership and management of the underlying data remained distributed. The project integrated and displayed information at city scale.
That distinction is useful because 3D city models were often judged by what they looked like. A recognisable skyline can be produced from relatively simple building massing, terrain and textures. An information model becomes more useful when buildings and infrastructure can be identified, queried and linked to other records. Digital Auckland sat on the path between those worlds, using a visual city environment to bring together information that had previously been harder to understand in combination.
Buildings meet geography
Building Information Modelling introduced another boundary. BIM systems could represent doors, walls, structural components, services and other parts of a building in considerable detail. GIS could place that building within roads, parcels, hazards, terrain, population and infrastructure networks. Combining GIS and BIM required compatible coordinates, data structures and object definitions.
Daniel Jones's 2019 University of Canterbury master's thesis examined that problem directly. The research proposed a workflow integrating BIM and GIS for urban risk and resilience, using Christchurch and the Taiora Queen Elizabeth II recreation and sports centre as a case. It explored semantic and web-service issues as well as the geographic relationship between a detailed building model and wider spatial context. The thesis used the term digital twin.
The project demonstrated these uses at its stated scale. It was a proposed geospatial workflow and research case, not proof that Christchurch operated a complete live digital twin of the city. That difference is central to the history. Research and prototypes often appear several years before the organisational processes, standards and funding required for persistent operational use.
GIS-BIM integration also exposed semantic problems hidden by good graphics. A BIM object might know that it is a door of a particular type and belongs to a particular room. A GIS building polygon might know the address, parcel, hazard zone and surrounding transport network. Converting either dataset carelessly can strip away the relationships that made it useful. The challenge became deciding which details should move across the boundary and how they would remain current afterwards.
From model to digital twin
Sources · 1
4. MBIE material recorded in the Master Research Register as P9C-S23 is the principal digital-twin route. It includes a 2018 National Digital Infrastructure Model briefing, a 2019 Wellington City Council workshop and later New Zealand examples. The term digital twin is used only where the evidence supports a persistent digital representation linked to updates, live or periodic data and operational/planning use. It is not applied retrospectively to every 3D model, BIM model or simulation.
By the early 2020s the phrase digital twin had become common enough to require restraint. It could describe anything from a static three-dimensional model to a continuously updated operational representation connected to sensors and business systems. Using the term too loosely makes the earlier history disappear, because almost any terrain model or city visualisation can then be rebranded after the fact. New Zealand projects developed through several stages.
A static 3D model represents geometry at a point in time. A structured 3D GIS or city model adds persistent objects and attributes. An integrated model can link those objects to external datasets, engineering records or services. A stronger digital-twin approach maintains some relationship between the digital representation and the changing real asset, place or system, potentially supporting monitoring, simulation or decision-making.
New Zealand research by the end of 2025 had moved well into this territory without demonstrating universal operational adoption. Urva Patel's 2025 Auckland University of Technology doctorate examined digital twins in relation to New Zealand urban well-being and the Treasury's Living Standards Framework. The research used public social, economic and environmental data, tested open-source platforms including Eclipse Ditto and FIWARE, and evaluated a proof-of-concept approach. A peer-reviewed Cities paper published in October 2025 developed the work into a well-being-oriented framework for urban digital twins.
This endpoint is deliberately less dramatic than a futuristic control-room image. It shows researchers asking what a digital twin should represent, how datasets should interoperate and whether an urban model can include social and well-being measures rather than only buildings and pipes. By the end of 2025, New Zealand digital-twin work included research, frameworks, pilots and selected operational systems.
Sharing 3D
Sources · 1
3. Three-dimensional distribution through lighter web viewers and scene services is treated as a delivery development, while the broader hosted/cloud/service architecture remains in Chapter 41.
Three-dimensional information also became easier to distribute during the 2010s, although progress varied. Large desktop scenes and specialist engineering models could be difficult to move between organisations, while lighter web viewers and streamed scene services made selected 3D information easier to inspect without the original authoring software. Web delivery allowed a 3D model to reach planners, managers and other users who were not operating specialist modelling systems.
Digital Auckland was an early example of that widening audience because the city model was used to communicate planning and construction scenarios rather than only to support technical modelling. SCIRT worked differently, with survey and engineering information moving through a federated delivery environment. Both cases required decisions about how much detail to expose and which source remained authoritative. A simplified shared view could be extremely useful even when the underlying engineering or cadastral record remained elsewhere.
Levels of detail became a practical issue. A building suitable for a city overview may need only its external form, while a BIM system can contain thousands of internal components. Loading every bolt, duct and fitting into a regional GIS would add complexity without helping most users. Conversely, reducing a detailed model to a simple box can remove exactly the geometry needed for clearance, access or risk analysis.
The exchange problem therefore became selective rather than absolute. Organisations did not need one enormous model containing every fact about every object. They needed reliable ways to link or transform information so the right level of geometry and attributes could reach the right task. That principle provides a direct bridge into enterprise GIS, where shared services and governance become necessary alongside the model itself.
The cost of the third dimension
Three-dimensional information creates practical costs that flat maps often avoid. Point clouds can be enormous. Detailed BIM models contain thousands of components. City models may combine terrain, imagery, buildings and underground infrastructure at several levels of detail. Moving all of that through ordinary networks and software can quickly reveal which parts of a workflow were designed when a shapefile and an orthophoto seemed large.
The data also changes more often than the geometry implies. A building is altered, a pipe is replaced, a road level changes or a survey is superseded. An unmaintained 3D model can become misleading because visual detail encourages users to assume currency. A simple two-dimensional layer with a clear update date may be more trustworthy than a beautiful model whose provenance is unclear.
Coordinates become harder as well. Horizontal location may use NZTM2000 while height depends on a vertical datum and the source survey. Engineering models can use local project coordinates. BIM may start from a building origin rather than national coordinates. Bringing these systems together requires transformations, agreed origins and a clear understanding of which heights are being compared.
The greater complexity also creates versioning and authority problems. A survey surface, design model and as-built model may all be valid for different purposes. The different models need comparison and reconciliation; the newest timestamp alone is insufficient. Mature 3D information management requires the same disciplines that earlier GIS required: provenance, identifiers, custodianship, metadata and clear responsibility for updates.
Working across professions
Three-dimensional GIS also changed who had to work together. A conventional GIS team could often manage maps, attributes and spatial databases largely within its own professional domain. Complex 3D work pulled surveyors, engineers, architects, planners, remote-sensing specialists and asset managers into the same information chain. Each group brought different assumptions about accuracy, scale, coordinate reference, levels of detail and which record was authoritative.
For GIS practitioners, this meant learning enough about neighbouring disciplines to avoid damaging the information during exchange. A detailed BIM model could be simplified for regional analysis, but not so aggressively that the feature needed for the task disappeared. A survey point cloud could be converted into a surface, but the uncertainty and control behind it still needed to be understood. A city model could combine many sources, but only if someone knew which version of each source was current.
Three-dimensional work became increasingly collaborative and made translation between disciplines a normal part of spatial practice, while GIS practitioners, surveyors and BIM modellers retained their distinct professional roles. By the 2020s the difficult part was often getting several technically different models to describe the same real place consistently enough that other people could trust and reuse them.
Choosing a dimensional model
Sources · 1
5. A visually detailed model is not automatically current, authoritative or interoperable. The chapter retains distinctions between visualisation, 3D GIS, engineering/BIM models, city models and digital twins where the source material supports them.
Organisations used three-dimensional models alongside two-dimensional GIS. Many questions remain easiest to answer in two dimensions. Property searches, thematic maps, network summaries and broad statistical patterns can become harder to read when every object is extruded into a scene. Three dimensions are useful when height, depth, volume, visibility or vertical relationships change the analysis.
This practical test explains why the strongest New Zealand cases are concentrated in terrain, surveying, infrastructure, dense urban development and complex property rights. In each case the vertical dimension carries information that a plan view alone cannot express adequately. Where it does not, a conventional map may remain clearer and cheaper. The history is therefore not a march from 2D inferiority to 3D superiority.
By the end of 2025 the third dimension had nevertheless become an ordinary part of the geospatial toolkit. Point clouds could come from airborne or terrestrial laser scanning and from photogrammetry. Surveyors and engineers exchanged richer geometry. Cadastral researchers and LINZ were preparing for more explicit 3D representation. City models, BIM-GIS workflows and digital-twin research were testing how that information could be joined and maintained.
Once organisations rely on many spatial datasets, applications, databases and services at once, the problem shifts from representation to shared organisational infrastructure. Databases, services, identity, governance and integration determine whether spatial capability can serve many users without requiring every one of them to know where the machinery sits.
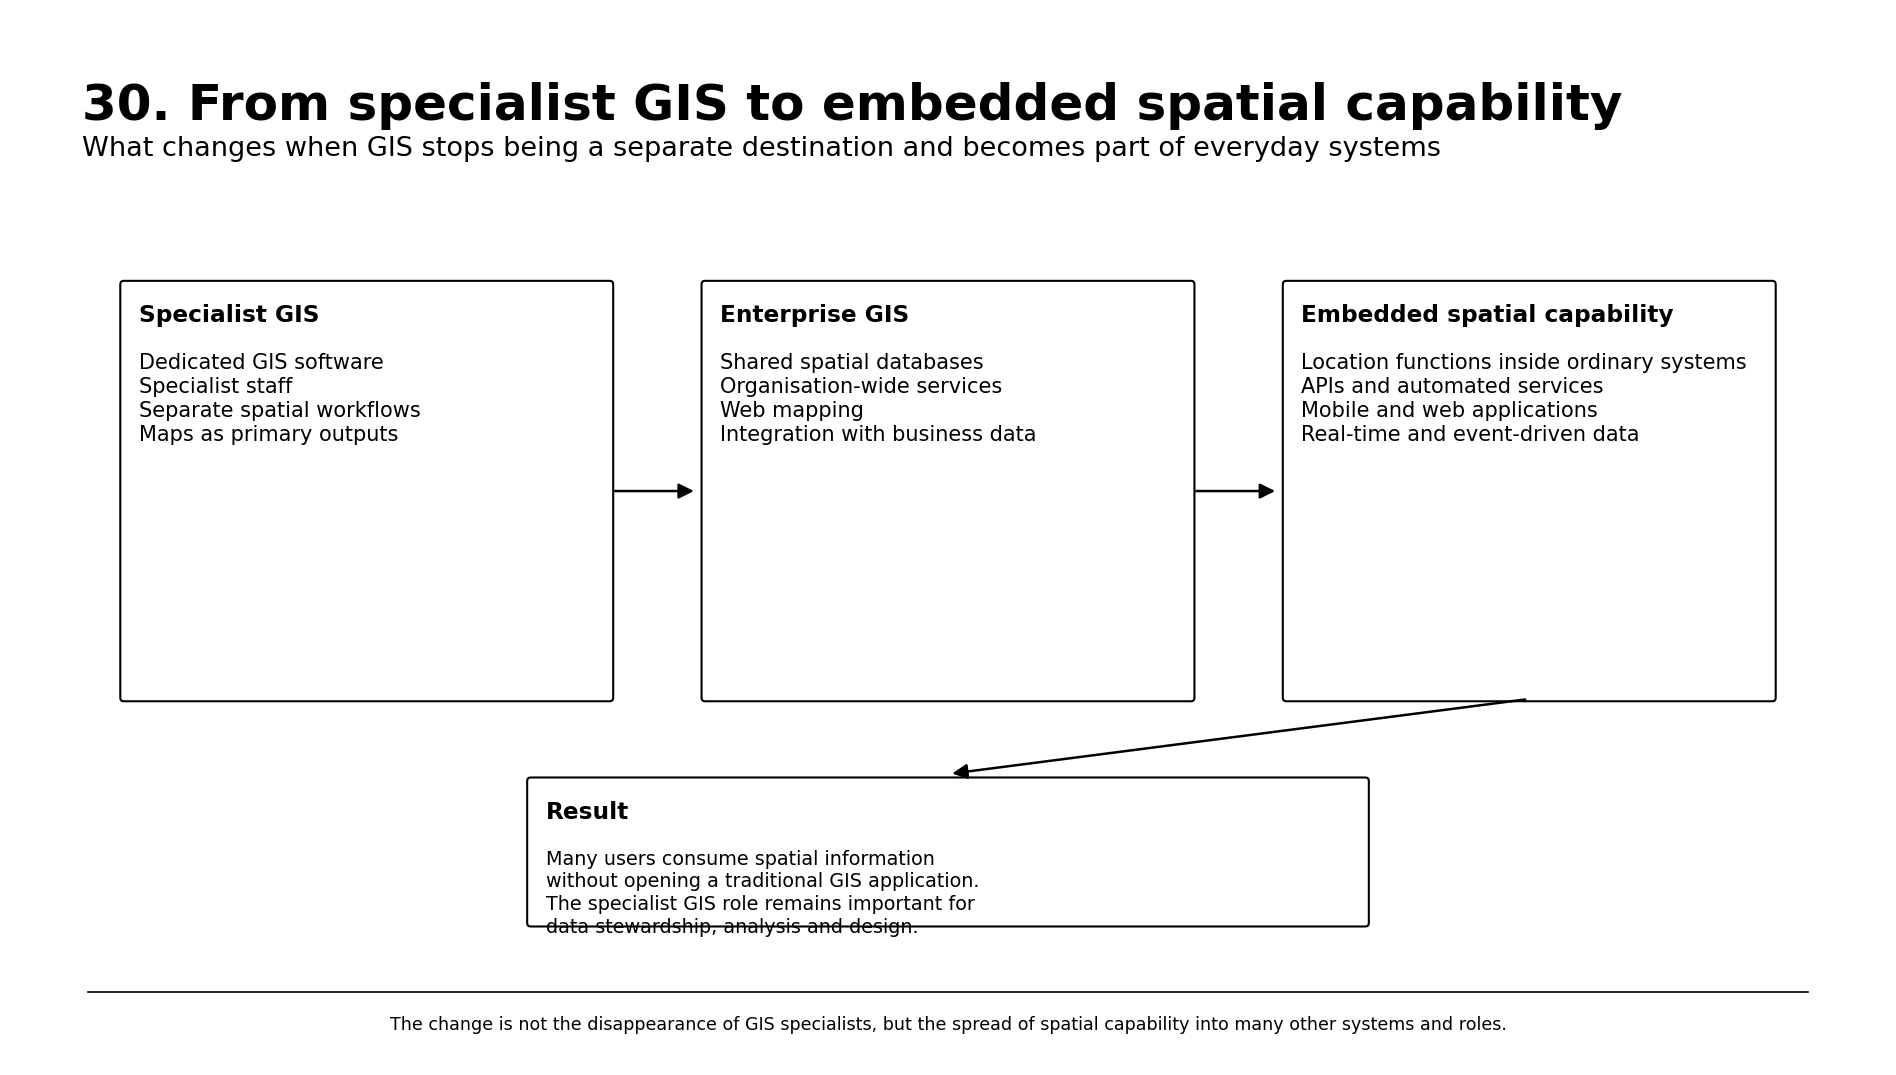
Image source · EX30-V01
NZ GIS History project, 2026. Whole-book explanatory synthesis.