The repetitive job
GIS has always involved repetition. A dataset arrives, its coordinate system is checked, unwanted records are removed, fields are joined, geometry is processed, a map is produced, and the result is exported. Early practitioners could perform every one of those steps manually, and often did. The problem appeared when the same sequence had to be repeated for another district, another month, another disease, another map sheet or another delivery cycle. Automation began when practitioners stopped treating each run as a fresh series of clicks and started encoding part of the sequence so the computer could repeat it according to defined rules.
That change was less dramatic than a new map on a screen, but it altered the work. The manual operator spent time carrying out each transformation. The automated workflow shifted effort towards deciding what the transformation should do, setting parameters, checking inputs, dealing with exceptions and deciding whether the output was good enough to use. Automation could process more information and make repeated work more consistent, but it also made an error easier to reproduce. A wrong assumption embedded in a script is admirably tireless. It will make the same mistake at three in the morning without becoming bored, suspicious or embarrassed. The operator’s job therefore moved from repeating the clicks to knowing when not to trust the result.
John Arnerich’s November 2025 retrospective traces Locus to GPS-phone experiments discussed in 2000, followed a few years later by FME. His account names Rotorua Lakes and Greg Bennett as early supporters and recalls Bruce Harold’s encouragement, adding people and working relationships to the software’s adoption history.
Source WEB-LOCUS-ORIGINS-2026 · John Arnerich, 25 Years of Locus, 2025
Sam Drummond’s November 2025 anniversary account describes ten years of Traverse and Seamless. The business concentrated on information moving between systems, including those used by councils and electricity distributors. Its history follows the growth of specialist integration services as geographic information became part of wider organisational workflows.
Source WEB-SEAMLESS-PEOPLE-2026 · Seamless anniversary account, 2025
Teaching the desktop the sequence
Sources · 1
1. Brabyn and Wilkins, Health Informatics Journal 7 (2001), provides the early desktop-automation case. ArcView Avenue automated repeated map-production operations in the Waikato notified-disease work and the paper reports maps at the most detailed regional scale being produced in less than a minute. The chapter does not claim this was New Zealand’s first GIS scripting project.
Public-health GIS included early examples of automation. By the late 1990s the Waikato Regional Public Health Unit had years of digital notified-disease records, while Lars Brabyn and Duane Wilkins at the University of Waikato were working on ways to map and analyse them routinely. Their 2001 paper described ArcView Avenue being used to automate map-production steps that would otherwise have required repeated selecting, calculation and map construction. Health-event maps for the Waikato Health Region could be produced in less than a minute at the most detailed scale used in the study.
The speed changed how the system could be used. A disease, time period or geographic scale could be changed and the process rerun without rebuilding the analysis from the beginning. That made mapping more useful for surveillance rather than only for occasional presentation. The underlying workflow still depended on geocoding quality, Census population data, privacy controls and decisions about which records were reliable enough to include. The script automated operations. It did not decide whether a doubtful address belonged in the analysis.
Avenue was only one scripting environment in a period when GIS products increasingly included ways to record commands, write macros or extend the desktop. ARC/INFO had AML, MapInfo had MapBasic, ArcView had Avenue, and later desktop environments added graphical processing models and general-purpose scripting. New Zealand practitioners automated GIS work using several languages and software environments. An analyst carrying out the same twenty operations every week had a practical reason to encode the sequence, whatever language or tool was available.
Models without typing everything
Practitioners also built reusable workflows through graphical tools. Graphical processing models allowed users to connect tools as a sequence, pass the output of one operation into the next and expose selected parameters for later runs. Graphical models widened access to repeatable workflow design. A practitioner could formalise a repeatable process without becoming a full-time software developer, and the model itself could show colleagues how the steps were connected.
Graphical models also required maintenance. A large workflow can become as opaque as a badly documented script, especially when expressions, SQL, embedded code or assumptions about file locations accumulate inside it. By the 2000s and 2010s GIS software increasingly gave practitioners several ways to turn manual analysis into a reusable process, from code to visual models to database logic.
Source notes
The project evidence is not strong enough to make a particular New Zealand ModelBuilder deployment a principal historical case, so there is no need to invent one.
Python enters the server
Sources · 1
2. Brent Wood’s 2022 NIWA technical retrospective supports the DASmap and database examples. Integrated Mapping in Christchurch, associated with John McCombs, developed DASmap in the early or mid-2000s using MapServer and Python MapScript. The later database comparison includes approximately 600 million earlier readings and roughly 40 billion later readings, automated weekly partitioning and spatial-SQL vessel-track processing. These remain retrospective source-specific figures rather than a continuous national chronology.
A useful bridge into a more mixed development environment comes from NIWA. A 2022 technical retrospective by Brent Wood records that DASmap was developed for NIWA in the early to mid-2000s by Integrated Mapping in Christchurch, with John McCombs named in the presentation. The application was written using MapServer and Python MapScript as a web application. The exact initial development year remains unresolved, but the technology and organisational attribution are explicit enough to show Python being used in a New Zealand geospatial application well before it became the default scripting language associated with many desktop GIS workflows.
DASmap also shows why automation history cannot be separated neatly into desktop, database and web eras. The application sat on top of NIWA’s Data Acquisition System database, which stored instrument and sensor readings from research vessels. The later database contained tens of billions of observations. By 2022 the challenge had expanded from displaying a track to querying and aggregating very large time-series data quickly enough for the existing application to remain useful. Python, MapServer, SQL and spatial database functions were parts of one working chain rather than rival ways of doing GIS.
Python later became attractive to GIS practitioners because it could connect many parts of that chain. It could call GIS tools, handle files, query databases, work with web services and perform ordinary operating-system tasks in the same process. That flexibility mattered as GIS stopped being a self-contained desktop application and became one component in wider information systems. It is still misleading to tell the history as if Python arrived and manual GIS disappeared. Plenty of work remained interactive, and plenty of automated systems used SQL, JavaScript, shell scripts, proprietary workflow tools or other languages instead.
The database does some of the work
Sources · 1
2. Brent Wood’s 2022 NIWA technical retrospective supports the DASmap and database examples. Integrated Mapping in Christchurch, associated with John McCombs, developed DASmap in the early or mid-2000s using MapServer and Python MapScript. The later database comparison includes approximately 600 million earlier readings and roughly 40 billion later readings, automated weekly partitioning and spatial-SQL vessel-track processing. These remain retrospective source-specific figures rather than a continuous national chronology.
Spatial databases moved another category of repeated work away from the desktop. A practitioner could download a dataset, select records and calculate a result every time it was needed, or the organisation could maintain a query, view or database process that derived the result close to the source. NIWA was using PostGIS at substantial scale by 2006, and by the end of that decade its technical discussions described very large point datasets and web mapping built around database and server components. Spatial processing could increasingly be maintained and rerun close to the data rather than rebuilt on the desktop for each use.
The DAS database rebuild makes that visible. Wood’s 2022 presentation describes an older PostgreSQL and PostGIS design holding about 600 million one-minute readings, with yearly partitions maintained manually. The rebuilt system stored about 40 billion one-second readings using PostgreSQL with PostGIS, TimescaleDB and hstore, with automated weekly partitioning. Queries could derive vessel tracks directly from stored coordinates using spatial SQL. A task that once might have required exporting records and constructing geometry elsewhere could be expressed as a maintained database operation.
This kind of automation rarely looks impressive on a wall. A database view does not have the visual impact of a new national map, yet it can remove thousands of repeated handling steps over its life. It also creates dependencies that are easy to forget when everything is running properly. Field names, source structures, database extensions and credentials become part of the workflow. When one changes, the process may fail immediately or, more dangerously, continue running and produce something plausible but wrong.
Moving data automatically
Sources · 1
3. Esri’s 2016 Auckland Council implementation account supports the ArcGIS/FME consolidation figures: 8,470 inherited geographic datasets reduced to 2,056 and 697 district-plan datasets replaced by 25. It is a vendor implementation source and does not establish that FME made the governance decisions or that every migration action was unattended.
By the 2010s, data transformation itself had become a distinct area of geospatial work. Extract-transform-load workflows moved information between systems while changing formats, schemas, coordinates, attributes or geometry. FME became one prominent tool in New Zealand practice, alongside scripts and other integration methods. Organisations used these tools to reduce repeated translation and reconciliation between systems.
Auckland Council provides a documented 2016 example. After the 2010 amalgamation, the council inherited a large and uneven collection of spatial information from predecessor organisations. An Esri account of the consolidation records the use of ArcGIS together with FME to migrate and rationalise the information into the new council environment. It reports that 8,470 geographic datasets were reduced to 2,056, and that 697 datasets associated with the district plan were replaced by 25. Those figures describe an enterprise migration rather than an unattended nightly process, but they demonstrate the scale at which repeatable transformation, schema change and controlled movement had become part of GIS work.
Large migration projects show another limit of the word automated. The transformations may run without a person editing every feature, but people still have to decide which source is authoritative, which old fields can be discarded, how classifications should be reconciled and what must remain traceable for legal or operational reasons. Auckland Council’s reduction in dataset count reflected governance and consolidation decisions as well as software tooling. The tools made thousands of repeated conversions manageable after people had designed a target structure and rules for moving the information. Automation works best when the repetitive part is clearly separated from the judgement that should not be repeated blindly.
This was one reason visual ETL workspaces became attractive to GIS teams. They made the transformation chain visible enough that a practitioner could follow data from a source through filters, attribute changes, coordinate transformations and geometry operations into a destination. A workspace could be rerun when a fresh source arrived and adjusted when the schema changed. That accessibility did not make the workflow self-explanatory, and large workspaces could become just as difficult to maintain as code. GIS practitioners increasingly designed, tested and owned data-integration workflows rather than handing occasional conversions to somebody else.
A different example appears in New Zealand’s 2024 hydrographic risk assessment. Raw Automatic Identification System vessel data arrived as large numbers of daily and monthly records. The documented workflow used FME to combine the files by month and reformat the relevant messages before loading the results into an ArcGIS geodatabase for track construction and analysis. This is ordinary ETL work, which is exactly why it belongs in the history. A substantial part of modern GIS consists of making data from one system usable in another without asking a person to repair every file by hand.
One process, several systems
Sources · 1
4. The later Safe Software KiwiRail case study documents a 2023 Cyclone Gabrielle photograph-processing chain including JPG/HEIC handling, EXIF extraction, resizing, coordinate/date transformation, metadata checking and upload through the Esri REST API. Because the case study was published after the cutoff, it is used only retrospectively to document the 2023 workflow. Chapter 42 owns the disaster narrative.
Organisations automated transfers between GIS and their wider business systems. Customer databases, asset registers, sensor stores, document systems and web applications all contained information that had to be reconciled with location. The work was no longer simply to run a buffer or dissolve a layer more quickly. A spatial workflow might need to retrieve records from one system, validate them, translate values, attach geometry, publish a service and leave enough information behind for the next run to know what had already happened. Integration work had become part of ordinary geospatial practice.
KiwiRail’s response to Cyclone Gabrielle in 2023 provides a compact example. Staff in the field captured large numbers of photographs in common phone formats, including JPG and HEIC, and the useful geographic evidence sat partly inside each file’s EXIF metadata. A later technical case study records FME being used to collect the files, extract location and time information, resize images that exceeded attachment limits, transform coordinates and dates, check metadata and send the results to ArcGIS Online through its REST API. The disaster response itself belongs to the preceding chapter. Here, the file handling, metadata extraction, transformation and upload form a semi-automated chain that avoided repeating the same work by hand.
Organisations also used repeated processing for routine work. A customer-facing map may look like a single application while drawing from a customer relationship system, a spatial database and a publishing environment. Once that arrangement is automated, the map is only the visible end of a chain of transformations. The organisation gains speed but also acquires a new dependency on interfaces between systems. A change to one database or API can break a process whose users never knew that system was involved. Automation therefore pushed GIS teams further into integration architecture even when the public-facing product still looked like a map.
Automation inside enterprise GIS
Sources · 1
The Auckland Council and NZTA case records illustrate automation around enterprise GIS services, migration, dashboards and field workflows; the section describes the operating model rather than a single tool.
Enterprise platforms made repeatable data movement and publishing more important. Auckland Council’s GFMO programme used FME alongside ArcGIS while consolidating inherited data and processes. In later enterprise environments, automation also carried data into services, dashboards and field applications. That work belonged to the operating model around GIS rather than to a single desktop tool.
Run it again tomorrow
Automation becomes infrastructure when the process is expected to run repeatedly rather than only when its author is sitting at the keyboard. Scheduled publication, database synchronisation, data extraction, cache generation, report production and quality checks all move GIS towards maintained services. The output may still be a map or dataset, but its production starts to resemble an operational system. Someone has to know whether the job ran, whether the source arrived, whether credentials still work and what should happen when an input is empty.
The temptation is to describe unattended processing as removing people from the workflow. In practice it often moves them to a different point. Staff design the process, monitor logs, investigate failures, approve changes and check results. A daily job that has run correctly for two years may become almost invisible until the morning it does not. Organisations then discover whether the documentation exists, whether the original developer is still around and whether the password belongs to a service account or to someone who left three restructures ago.
A small 2020 COVID-19 response system shows the same operational idea at a much smaller scale. Manaaki used Survey123 Connect for data entry into a hosted ArcGIS Online feature layer, with maps, dashboards and web applications built around that shared information. Its surviving technical design records a copy of the operational layer being extracted each day for backup and analysis. That daily extraction is a modest form of automation compared with national production systems, but it illustrates the change well. The value came from making a repeatable safeguard part of the operating arrangement rather than relying on somebody to remember to export the data when the day became quiet enough.
Scheduled work also made ownership harder to ignore. A manually produced map normally has an obvious operator because somebody has to make it. A scheduled job may have no visible author at the moment it runs. The organisation therefore needs to know who receives a failure alert, who can change the credentials, who understands the data licence and who decides whether a missed run can simply be restarted. These questions sound administrative until a process feeds a public service or an operational decision. Automation turns some ordinary GIS housekeeping into service management.
By the 2010s and 2020s, web services, enterprise databases and applications depended on repeated processing behind the interface. The user might see an updated layer, dashboard or service without knowing whether an analyst had touched the data that day. GIS output was becoming a maintained process as much as a document produced on request.
Source notes
The project evidence does not support one clean date when scheduled GIS became ordinary across New Zealand.
Maps become builds
Sources · 1
5. The 2009 Topo50 technical evidence supports automated portrayal rules and rapid generation of production files once maintained source data and rules were ready, while five cartographers continued to resolve text conflicts and exceptions. Later Future Topographic Maps documentation is used only to document the direction of a programme that began in November 2024, including QGIS and Kart spatial version-control work. It is not treated as proof of a completed replacement production environment by the end of 2025.
National topographic production used repeatable build processes. When LINZ released Topo50 nationally in September 2009, the new maps were generated from a maintained national topographic database rather than compiled as isolated sheet drawings. A contemporary technical account describes cartographic rules generating most of the portrayal automatically, with sheet-specific information assembled from controlled definition files. Once data and rules were ready, production files could be generated in roughly ten to fifteen minutes.
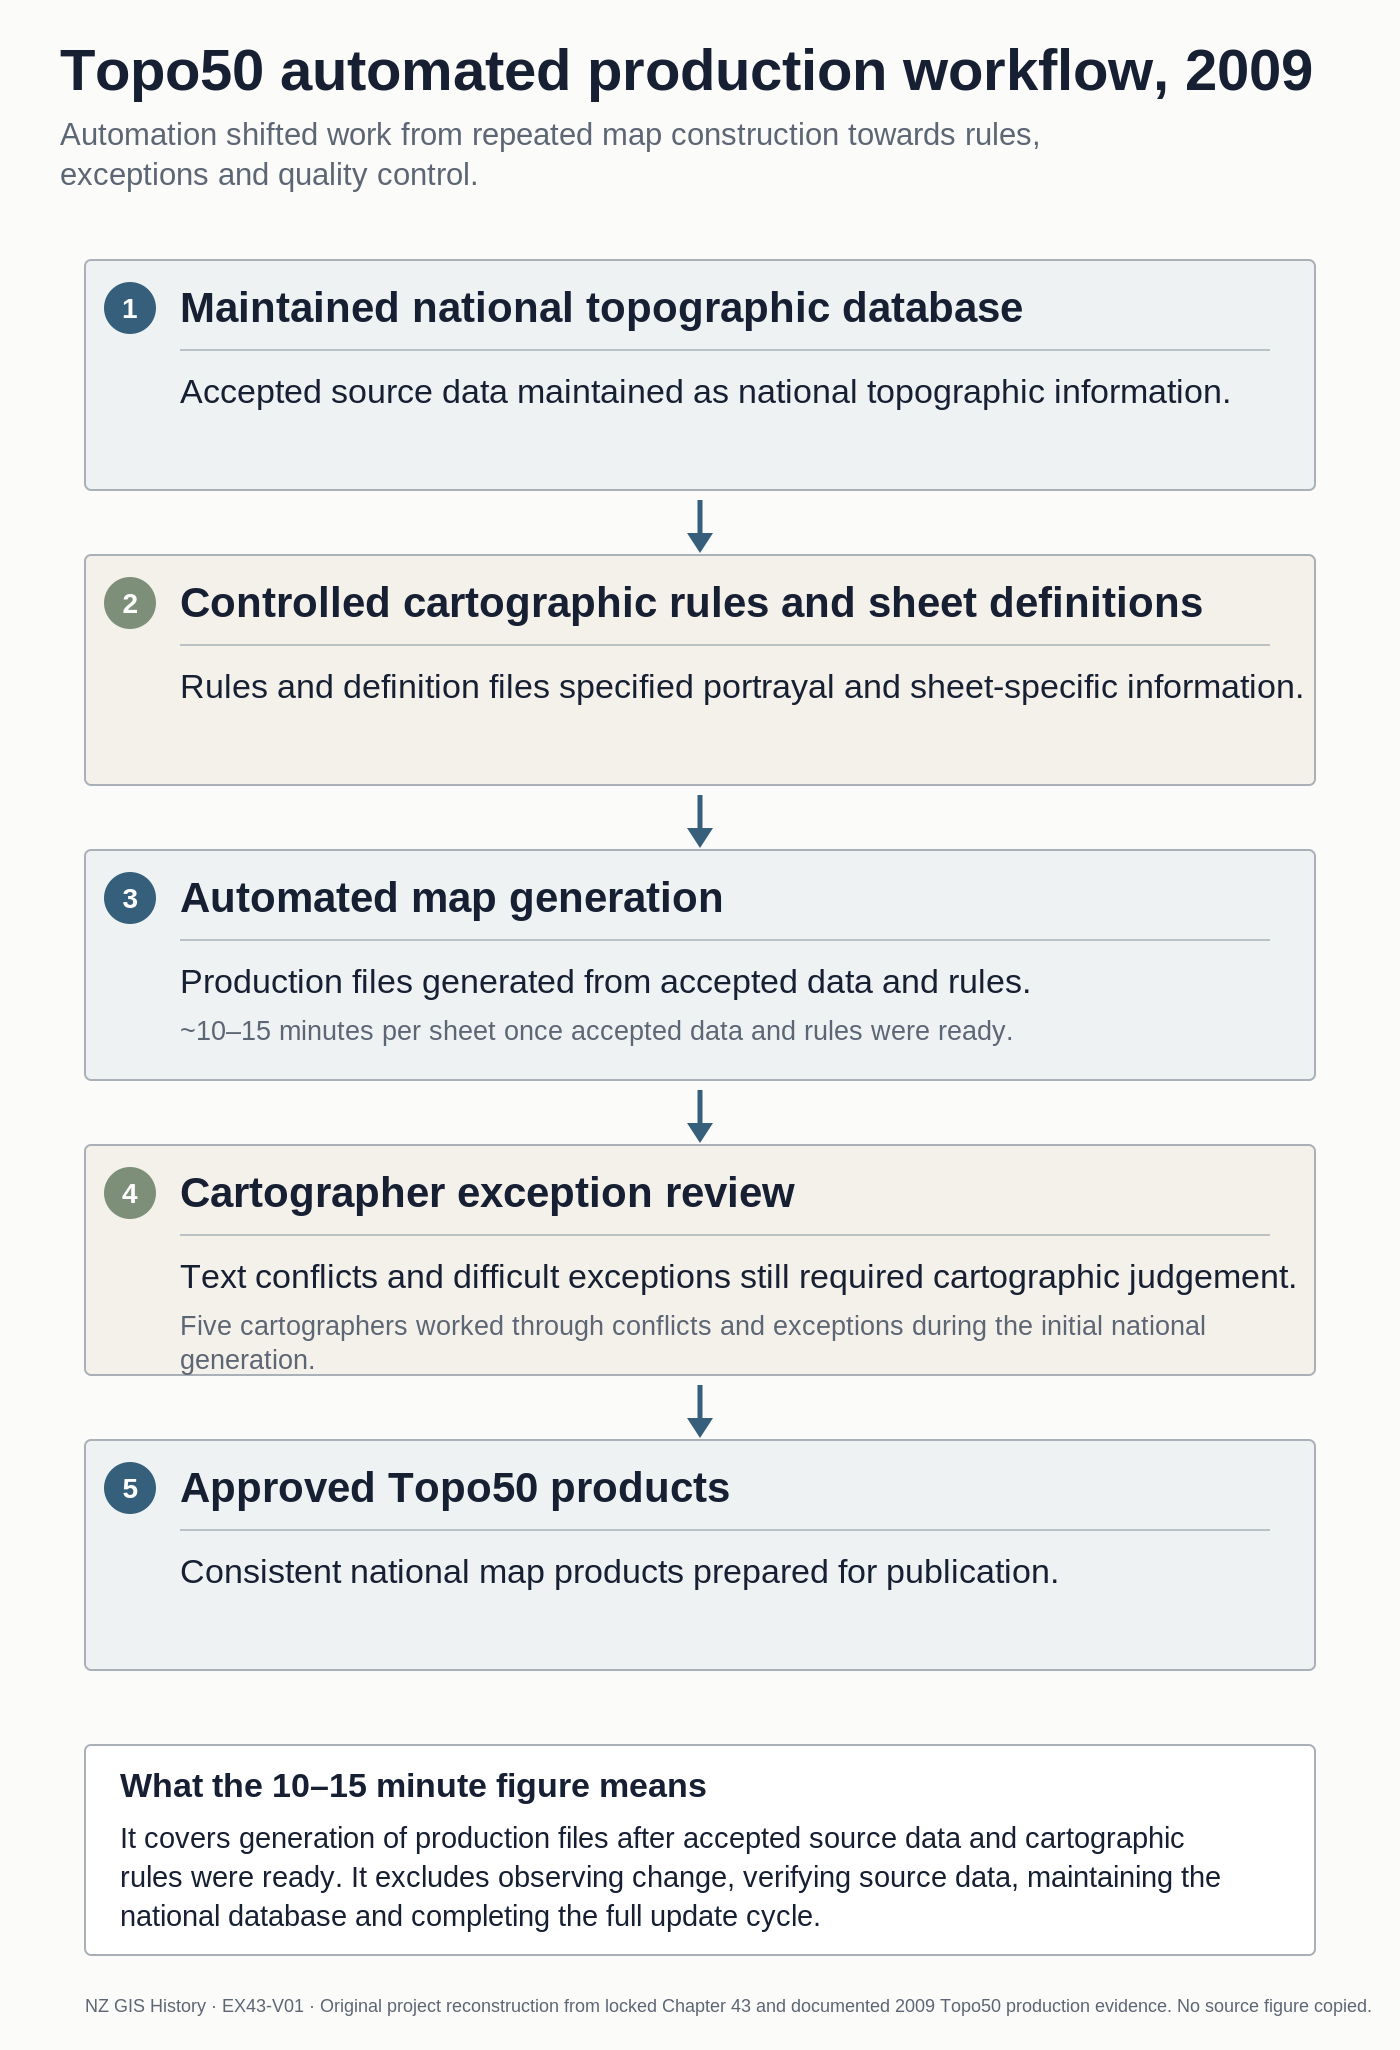
Image source · EX43-V01
NZ GIS History project, 2026. Reconstruction based on documented 2009 Topo50 production evidence.
The time figure needs to be understood properly. It did not mean a new road could be observed, verified, edited and published nationwide in fifteen minutes. It meant that accepted database content could be turned into cartographic products far faster than rebuilding a sheet manually. Five cartographers still worked through text conflicts and other exceptions during the initial Topo50 generation. The rule system removed repeated production labour while making the difficult exceptions more visible. Automation changed where cartographic judgement was applied.
That pattern continued into the next generation of topographic production. LINZ began the Future Topographic Maps programme in November 2024 to replace ageing technology. Later programme documentation describes QGIS being used for editing and map layout and Kart being used for spatial version control. The national topographic programme managed geographic data, configuration and changes as inputs to a repeatable build process.
Reproducibility becomes part of the job
Repeatable processing offered more than speed. It could make a method inspectable. A script, SQL query, graphical model, workspace or configuration file can preserve the logic used to create an output. If the same inputs and parameters remain available, another practitioner has a better chance of rerunning the work than if the method survives only as a remembered sequence of menu choices. National datasets and operational services may need to be rebuilt regularly, so the method itself becomes part of the production record.
Reproducibility required documented inputs, dependencies and processing steps. The software version may change, a library may disappear, a web service may alter its response, or a source dataset may gain a new field while losing an old one. Paths, credentials and environment settings can be as important as the visible processing logic. A workflow that depends on “C:\GIS\Final\Final2\ReallyFinal” is still automation, but it is not yet much of an institutional asset.
Version control brought software-development practice closer to GIS production. By the 2020s some spatial teams were managing scripts, configuration and even geographic change histories through repository-style tools. LINZ’s use of Kart in the Future Topographic Maps programme is a particularly direct example because the organisation describes it as spatial version control. The purpose is not to make every cartographer into a software engineer. It is to make change traceable, comparable and recoverable in a production environment where the dataset itself is continually evolving.
Automation reaches imagery
Sources · 1
6. Ministry for the Environment material on the LUCAS 2020 Land Use Map supports Sentinel-2 imagery, automated or deep-learning-assisted processes and continued manual interpretation and quality assurance. The chapter uses this as the bridge from deterministic automation to machine learning without treating model output as ground truth.
Remote sensing shows the same transition at national scale. Early satellite work required specialists to perform much of the image handling and classification explicitly. By the 2020s automated processes could assist with identifying likely change across entire national datasets. The Ministry for the Environment’s documentation for the LUCAS 2020 Land Use Map records a workflow using Sentinel-2 imagery and analytical methods that included automated and deep-learning steps alongside manual interpretation and quality assurance.
That combination is more historically useful than a claim that artificial intelligence replaced image interpreters. LUCAS exists to support national greenhouse-gas reporting, so a convincing classification is not enough. Land-use classes have definitions, changes need evidence, and errors can affect reporting. Automated methods could narrow the search, process imagery consistently and help find candidate changes. People still had to review the result and decide whether the classification was defensible.
Conventional automation begins to meet machine learning when some patterns are learned from examples rather than specified step by step. A script follows rules written by people. A trained model can infer patterns from examples and apply them to new data, although the model still sits inside a larger human-designed workflow. By the end of 2025 New Zealand geospatial practice contained both. Automation developed from repeated commands into system integration and more complex analysis.
Errors at scale
Automation could repeat an incorrect assumption or processing rule across many records. It is that automation can repeat an ordinary mistake very efficiently. A coordinate reference system can be wrong. A source can change the spelling of a field. Null values can appear where the script expects numbers. An API can return a different structure. A classification threshold can work well in one landscape and poorly in another. If the workflow processes the whole country before anyone checks a sample, consistency becomes a liability.
The practical response is equally unglamorous: validation, logging, test data, exception handling, peer review and output QA. Automated topographic production still required cartographers to inspect conflicts. LUCAS automation still retained quality control. The Waikato disease-mapping work excluded low-confidence geocodes rather than allowing the script to make uncertainty disappear. Good automation therefore defines both routine processing and the behaviour expected when input is incomplete, unexpected or plainly wrong.
This also changes the meaning of quality assurance. In a manual workflow, a practitioner may notice an odd value while working through the data. In an automated pipeline, that incidental human observation may disappear. Checks have to be designed deliberately, which can make them stronger if done well. A process could check every record against stated rules. The quality work has not vanished. It has been moved into the design of the system and the review of its outputs.
Maintaining automation
Automation also created a new kind of geospatial inheritance. Scripts, models and scheduled jobs can remain useful long after the person who created them has changed role or left the organisation. The workflow can become increasingly relied upon while its origin becomes increasingly vague. This is how a small utility written to solve a temporary problem can spend ten years becoming critical infrastructure without ever receiving the courtesy of a proper name.
The maintenance problem explains why documentation and ordinary engineering disciplines became more relevant to GIS teams. A useful script needs more than code that runs once. It needs understandable inputs and outputs, controlled dependencies, an owner, a way to test changes and enough explanation that another person can fix it. By the 2010s and 2020s GIS practitioners increasingly encountered Git, repositories, APIs, databases and deployment processes because their work was becoming entangled with software and data engineering. Many analysts could continue without writing complex applications, while a growing share needed to understand the automated machinery around them.
The boundary between GIS specialist and developer therefore became less tidy. Some practitioners remained primarily cartographers, analysts, remote-sensing specialists or data custodians. Others moved towards scripting, database design, integration and application development. Many sat somewhere in the middle, able to inspect a script, alter a query or repair a model without describing themselves as programmers. Automation widened the range of technical roles around GIS rather than replacing the discipline with software development.
Oversight of automated work
By the end of 2025 automation was embedded across New Zealand geospatial work at several levels. A desktop analyst could reuse a processing model or script. A database could derive geometry and aggregate billions of readings. An ETL process could move and reshape information between enterprise systems. A national mapping workflow could generate products from maintained data and rules. Remote-sensing production could combine automated classification with human review. None of these required the same technology, but all reduced the amount of repeated handling needed to produce a reliable spatial result.
Staff maintained and checked the automated processes. It was the ability to choose where human attention was worth spending. Repetition could be delegated to code or configured workflows, while people concentrated on requirements, exceptions, interpretation and quality. That arrangement also created new obligations to maintain the automation itself. A workflow that saves a thousand hours this year can become a thousand-hour problem later if nobody understands how it works.
The final chapter begins at that boundary. Traditional GIS automation encoded rules in scripts, models, SQL and production systems. Machine learning increasingly allowed some patterns to be learned from examples rather than specified step by step. Generative AI then began changing how practitioners produced code, searched documentation and interacted with spatial systems. By the end of 2025 the question was no longer whether GIS work could be automated. It was how much of the process could be delegated while keeping enough human understanding to know when the result was wrong.