Read the history
Explore the chapters.
Read in sequence or start with a topic. Each chapter connects to the people, organisations and events described.
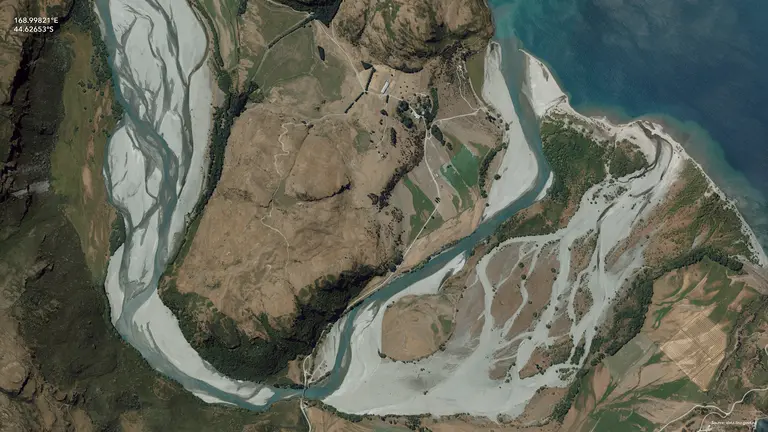
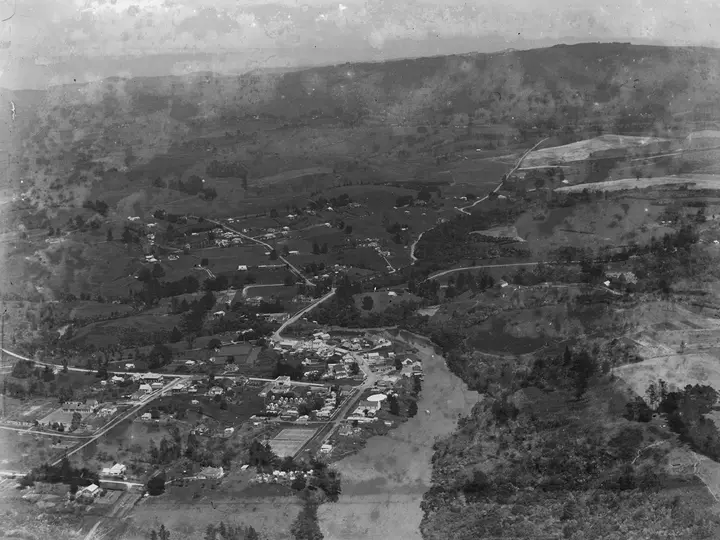 Chapter 1Maps before computersBefore computer mapping, New Zealand’s survey offices had built and maintained a dense record of parcels, control, topographic sheets, census districts, aerial photographs and resource maps. This chapter follows how plans, indexes, triangulation, analogue mapping and statistical geography became source material for digital systems, while carrying each record’s purpose and limitations with it.Read chapter →
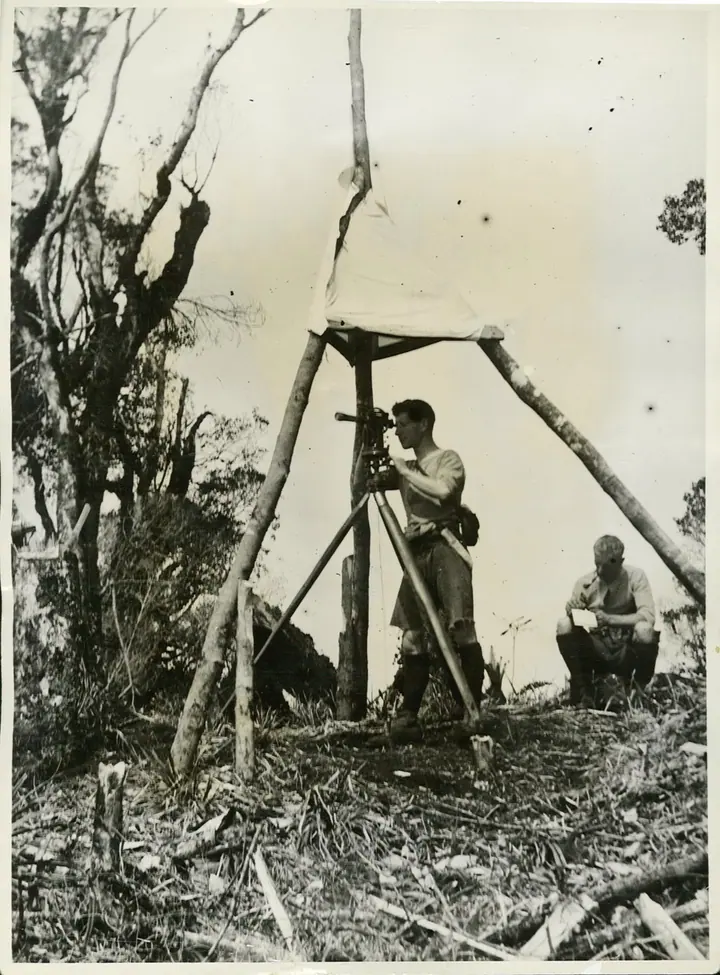 Chapter 2Survey calculationsHow computers entered New Zealand survey and engineering work through coordinates, control networks and route calculations, while most maps remained on paper. Follows the shift from numeric output to reusable digital geometry.Read chapter →
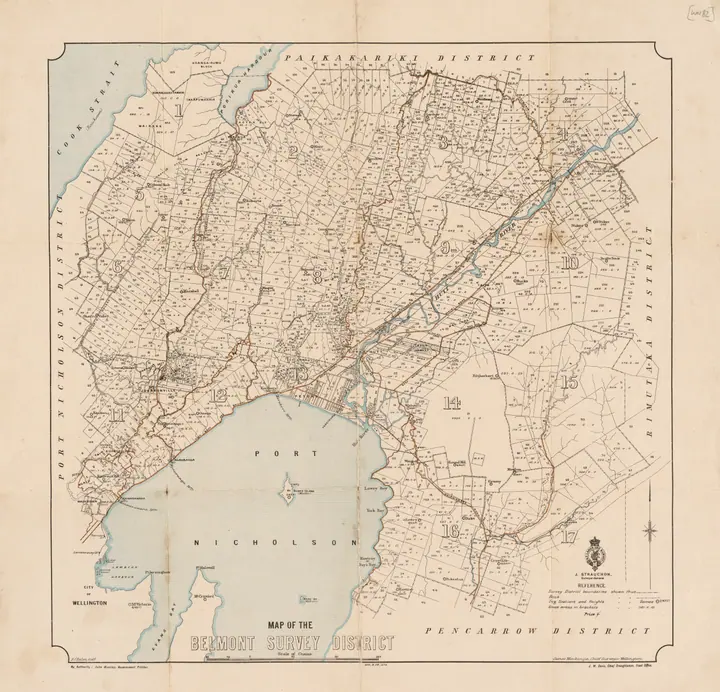 Chapter 3Computer cartographyBy the late 1970s, the Department of Lands and Survey was using a computer-assisted system to convert cadastral mapping into digital form. A paper cadastral sheet was fixed to a large digitising table, control points were establisRead chapter →
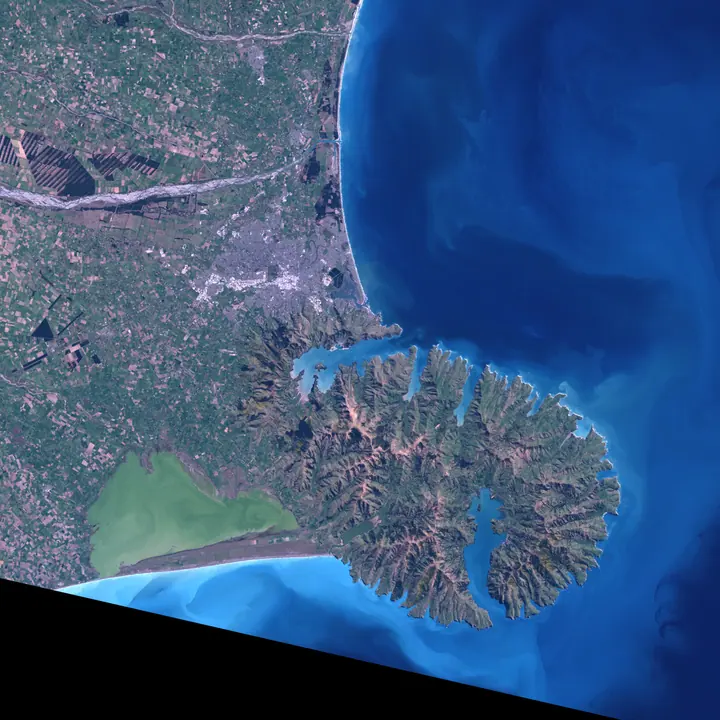 Chapter 4Early remote sensingIn October 1975, the Department of Scientific and Industrial Research’s Physics and Engineering Laboratory in Lower Hutt received a Landsat II scene of New Zealand for the organised national investigation programme. Dr M. C. ProbiRead chapter →
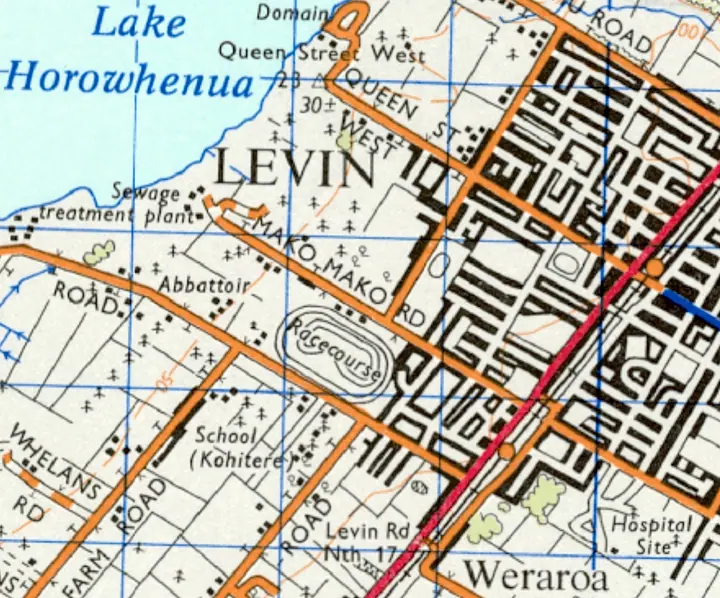 Chapter 5Digital land inventoriesIn 1973 the Ministry of Works and Development began the first edition of the New Zealand Land Resource Inventory, usually shortened to NZLRI. The programme brought together several kinds of physical land information and mapped theRead chapter →
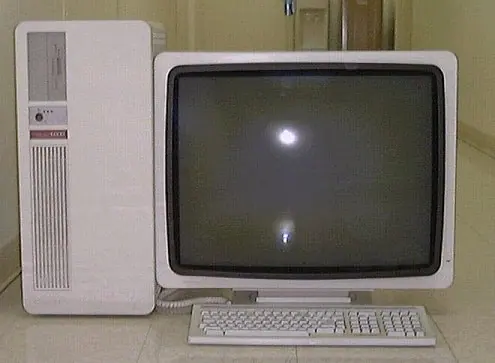 Chapter 6Early GIS systemsOn 26 June 1989 a national conference opened in Wellington under the title Getting it all together with GIS. The published proceedings described it as the First National Multi-Disciplinary GIS Conference and ran to 116 pages. The Read chapter →
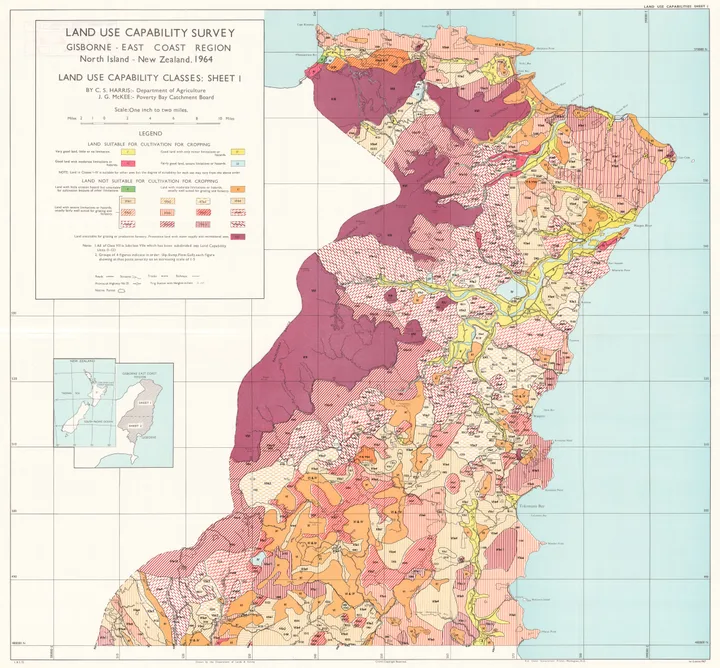 Chapter 7Land assessmentChapter 5 followed the creation and digitisation of the New Zealand Land Resource Inventory and the LADEDA system. The inventory itself was built from stereo aerial photography, geological and soil information, topographic maps anRead chapter →
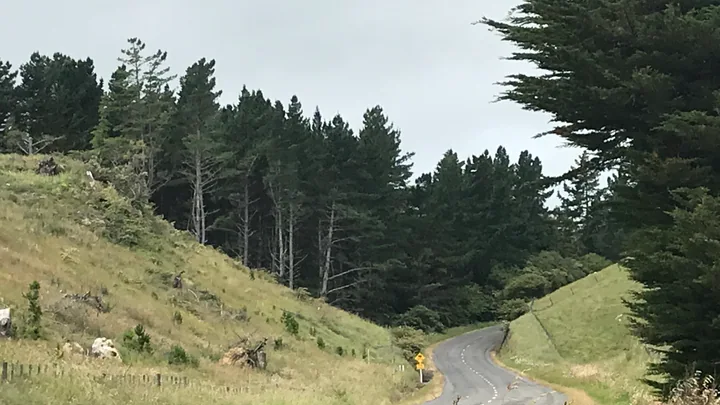 Chapter 8Forestry GISPlantation forests require repeated mapping. Stands are planted, thinned and harvested. Roads are built and extended, stream crossings change, firebreaks are maintained, and compartments that once held trees of one age may containRead chapter →
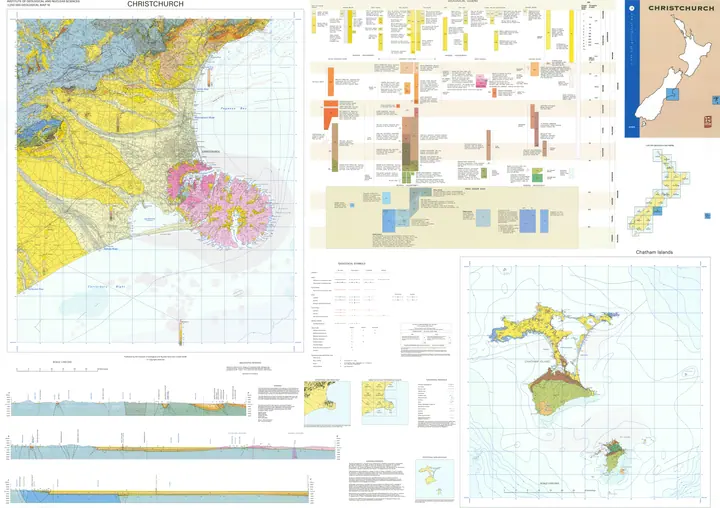 Chapter 9Scientific mappingNew Zealand scientists had been making maps long before GIS arrived. Geologists compiled formations and structures from field observations, samples, aerial photographs and earlier surveys. Ecologists divided the country into regioRead chapter →
 Chapter 10Government GISBy the middle of the 1980s, geographic computing inside the New Zealand state was no longer confined to one experimental programme or one specialist scientific group. The Ministry of Works and Development had been maintaining and Read chapter →
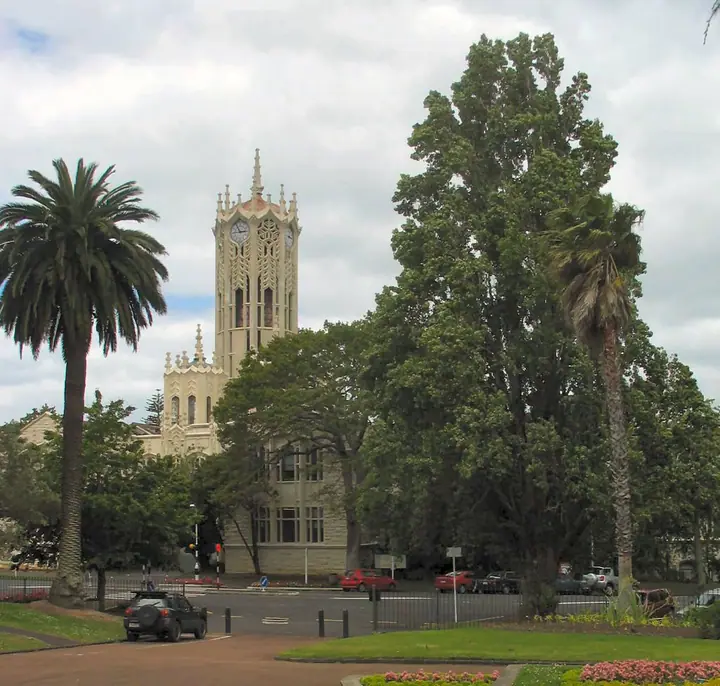 Chapter 11University teaching and researchIn 1985, when the University of Auckland was already teaching GIS to senior undergraduates in Geography, there was no settled New Zealand pathway for becoming a GIS practitioner. The software was specialised, useful digital data wRead chapter →Chapter 12Companies and user groupsBy the early 1990s, buying GIS software was only the opening bid. The demonstration was often the easy part. An organisation still needed computers capable of running it, data in a usable format, someone who understood the installRead chapter →
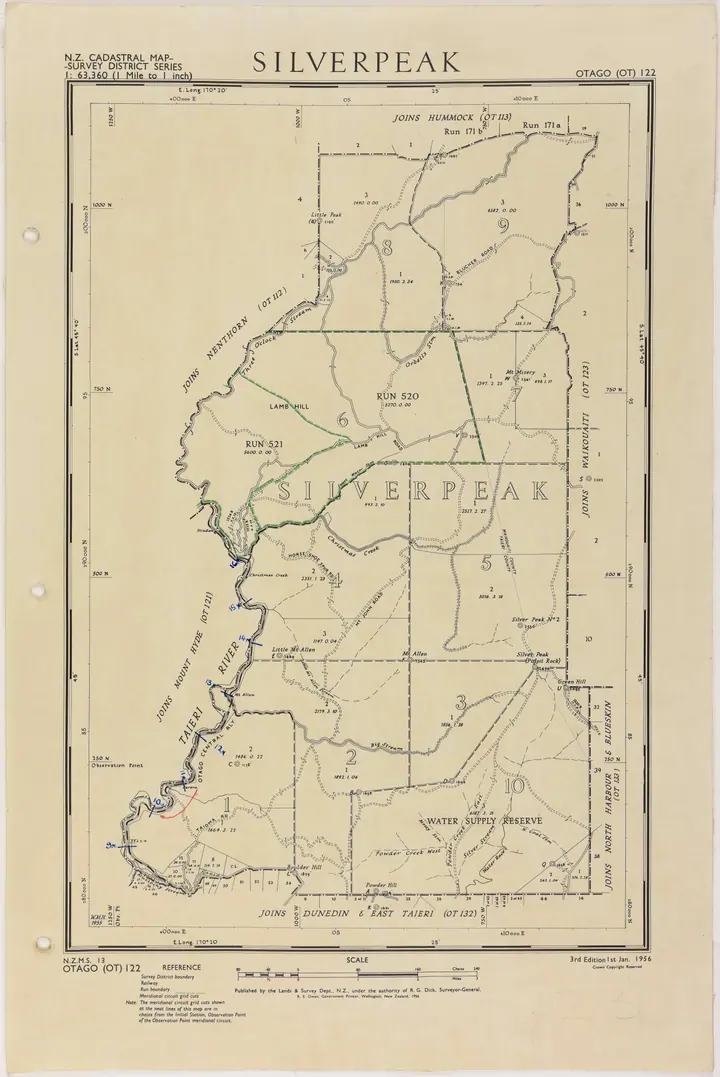 Chapter 13The digital cadastreA cadastral line on a computer screen can look wonderfully certain. It is thin, continuous and usually drawn with more geometric neatness than the paper map that preceded it. By the late 1980s New Zealand was building a national dRead chapter →
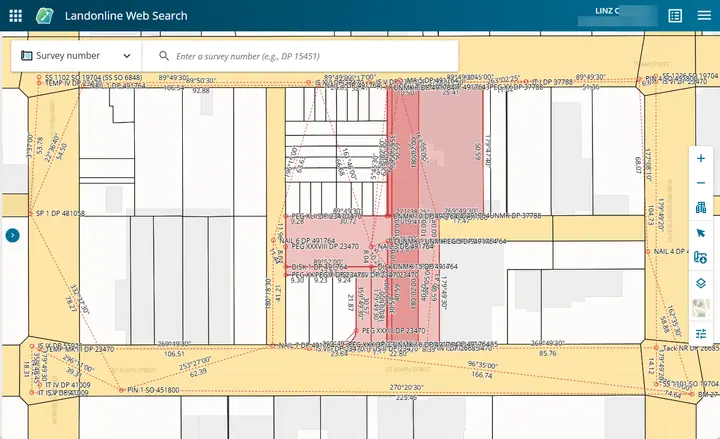 Chapter 14LandonlineWhen Land Information New Zealand was created in 1996 it inherited two national record systems that had grown up for different purposes. The survey and cadastral side came largely from the Department of Survey and Land InformationRead chapter →
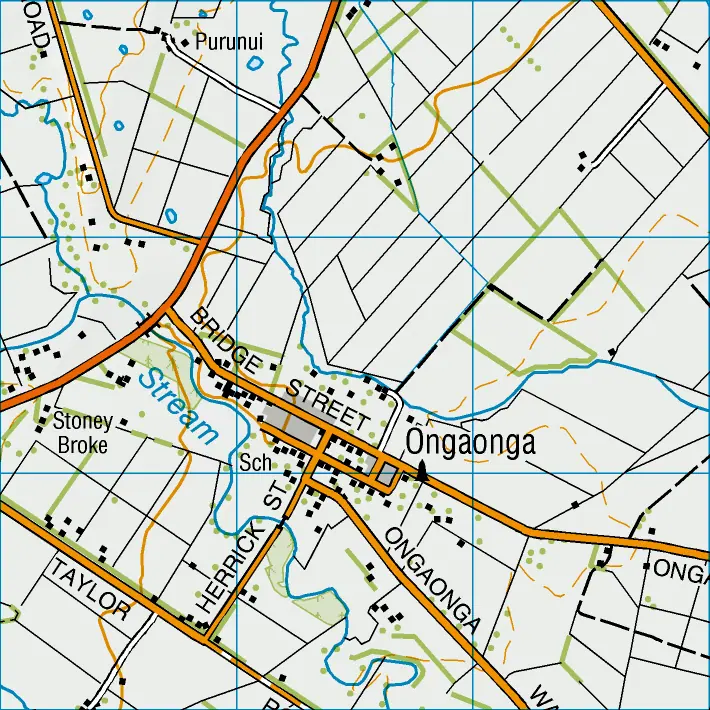 Chapter 15Digital topographyA printed topographic map makes geography look as if it naturally belongs to a sheet. Roads end at a neat border, contours disappear into the margin, place names are positioned for the reader, and the whole landscape is arranged aRead chapter →
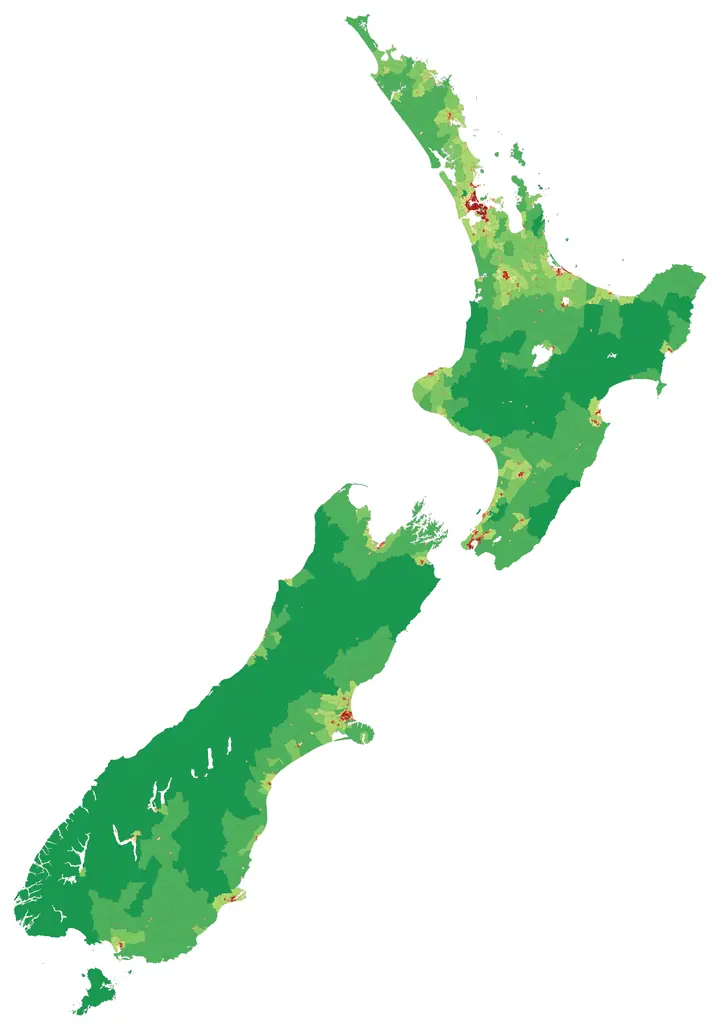 Chapter 16Census geographyA topographic boundary usually follows something that can be seen or measured in the landscape. A cadastral boundary represents a legal interest in land. Census geography has a different job. Its lines divide the country into unitRead chapter →
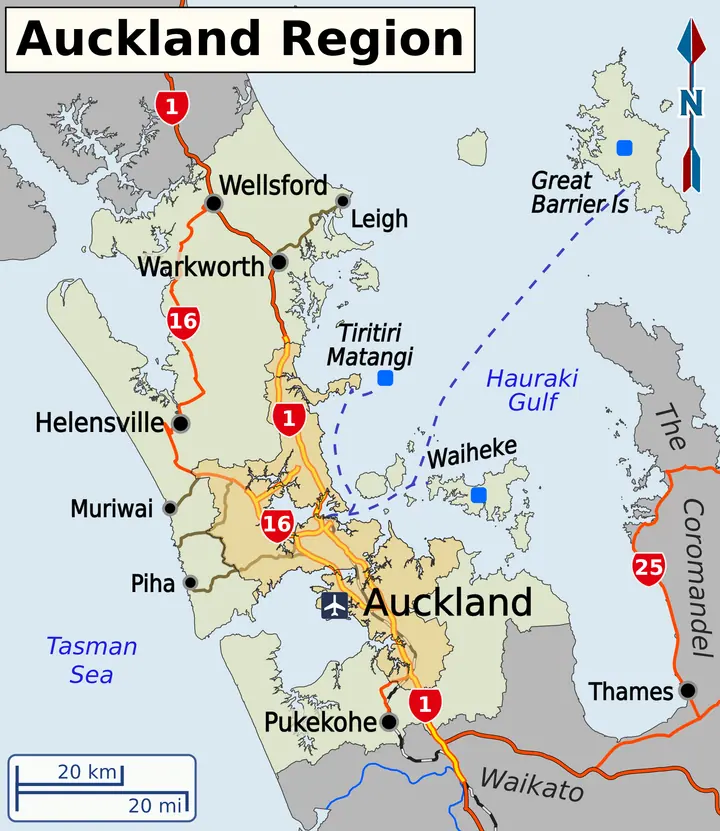 Chapter 17Roads, addresses and propertyAn address looks simple because most of the work has already been done. A number and road name can usually take a courier, ambulance, council officer or mapping application to one recognisable place. Inside a GIS, however, that apRead chapter →
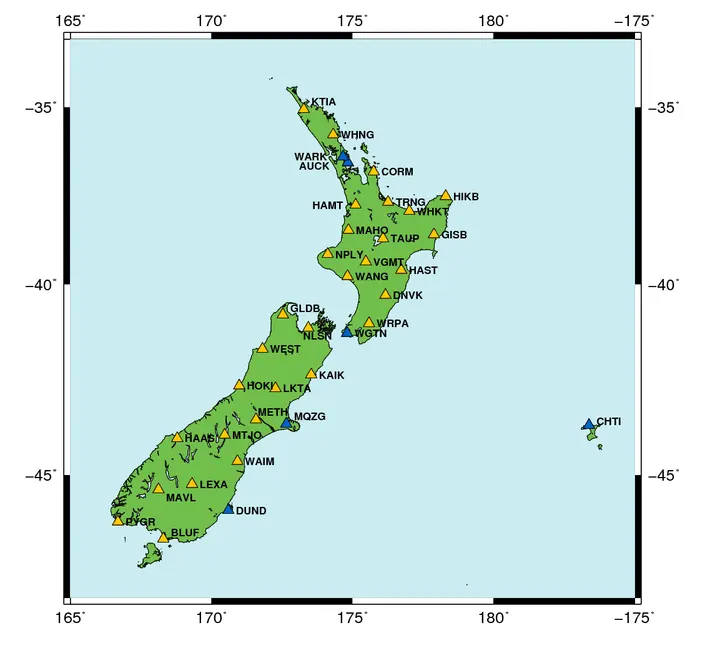 Chapter 18GPS in practiceAt Taiaroa Head in 1994, a GPS survey for a wildlife-management project began with one receiver staying put. It was set over a known trig station on the summit of the headland and left to track the satellites. A second survey-qualRead chapter →
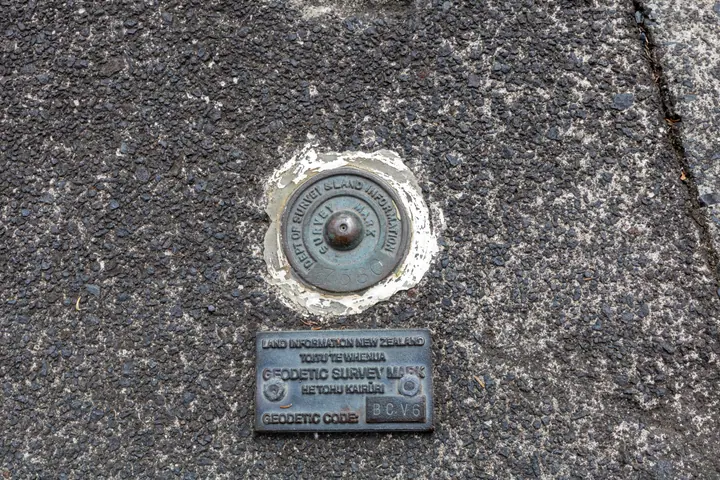 Chapter 19The national coordinate systemBy the early 1990s, New Zealand surveyors could determine positions from satellites with increasing precision, but the national coordinate framework had been built for a different era. The New Zealand Geodetic Datum 1949 had proviRead chapter →
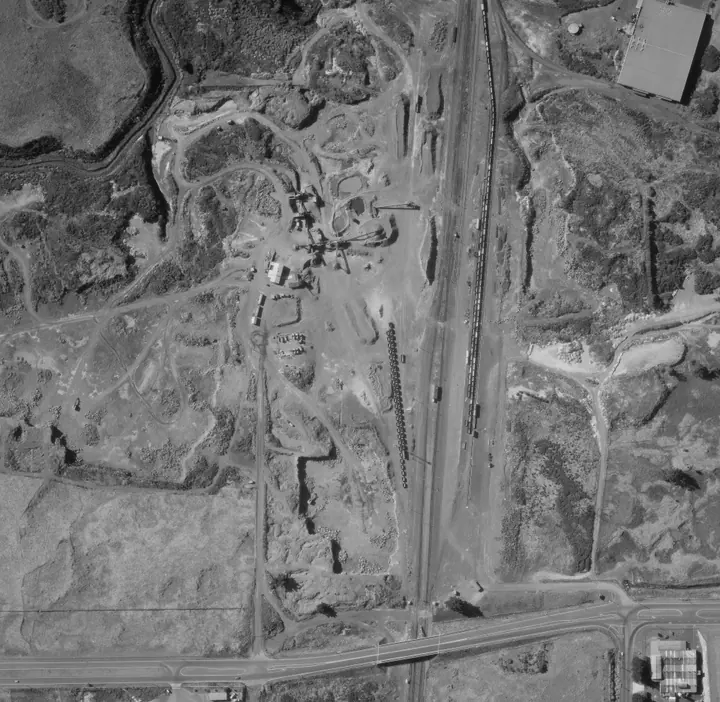 Chapter 20Aerial imageryAerial photographs had been used in New Zealand mapping for decades before GIS became common. They helped photogrammetrists compile topographic maps, foresters interpret stands, engineers inspect routes and land-resource staff reaRead chapter →
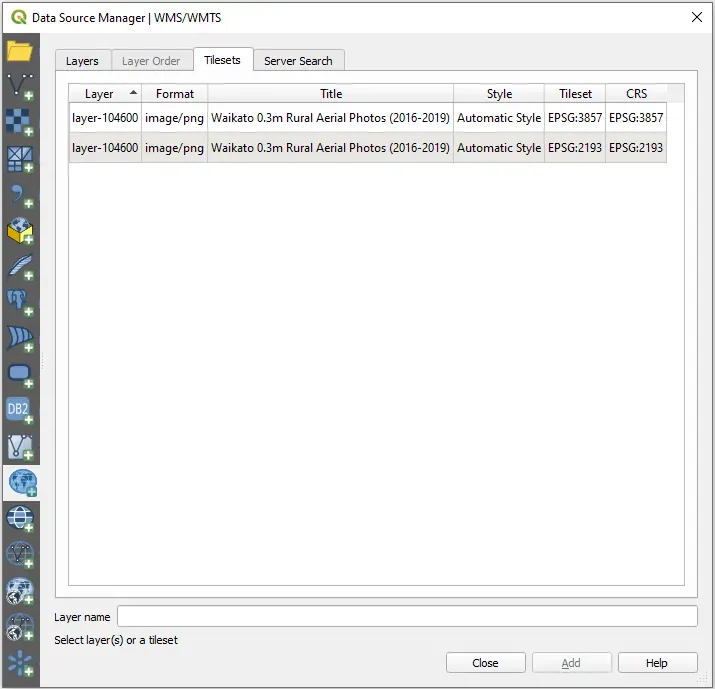 Chapter 21Spatial data infrastructureBy the 1990s New Zealand had plenty of digital geography without having anything resembling one national GIS. DOSLI and later LINZ maintained cadastral, geodetic and topographic information. Statistics New Zealand maintained censuRead chapter →
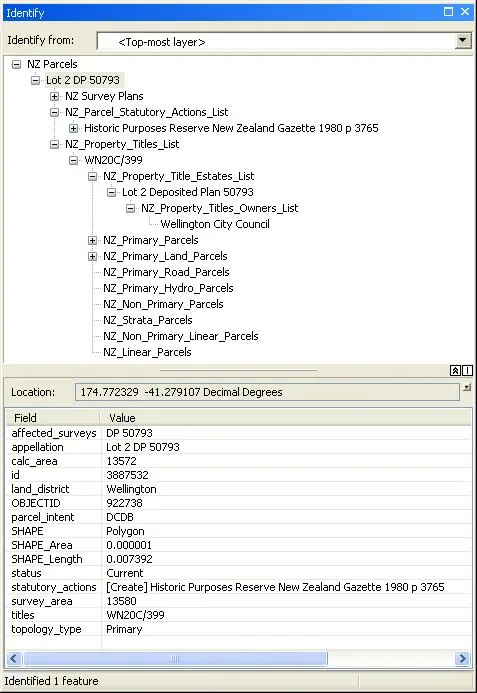 Chapter 22Desktop GISIn the late 1980s a New Zealand organisation that used GIS could still have a fairly literal GIS room. A GIS installation could be somewhere you walked into, because the room contained a fair portion of the system. The more capablRead chapter →
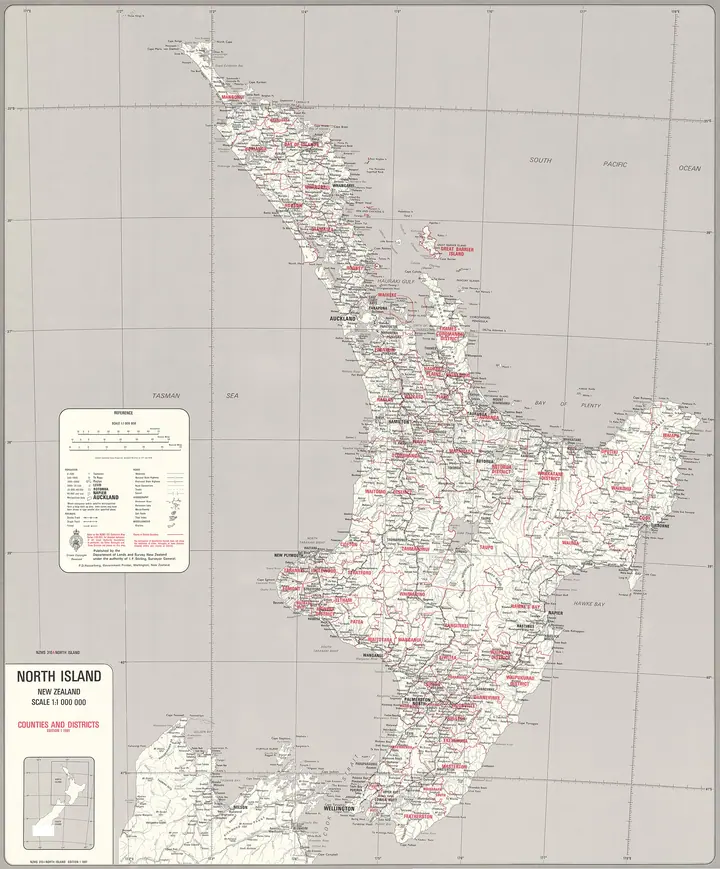 Chapter 23Council GISOn 1 November 1989 New Zealand’s local-government map changed abruptly. Hundreds of local bodies, including cities, boroughs, counties, catchment boards and other authorities, were reorganised into 86 regional and territorial authRead chapter →
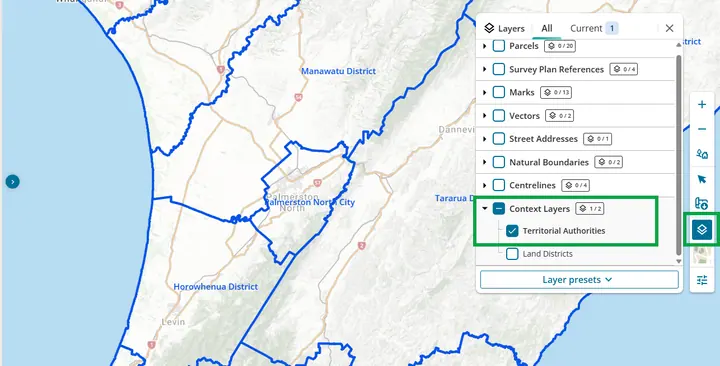 Chapter 24GIS across governmentBy the late 1990s, a government task could use GIS without becoming a GIS project. The specialised systems described in Chapter 10 had established that departments could maintain national spatial databases and digital mapping enviRead chapter →
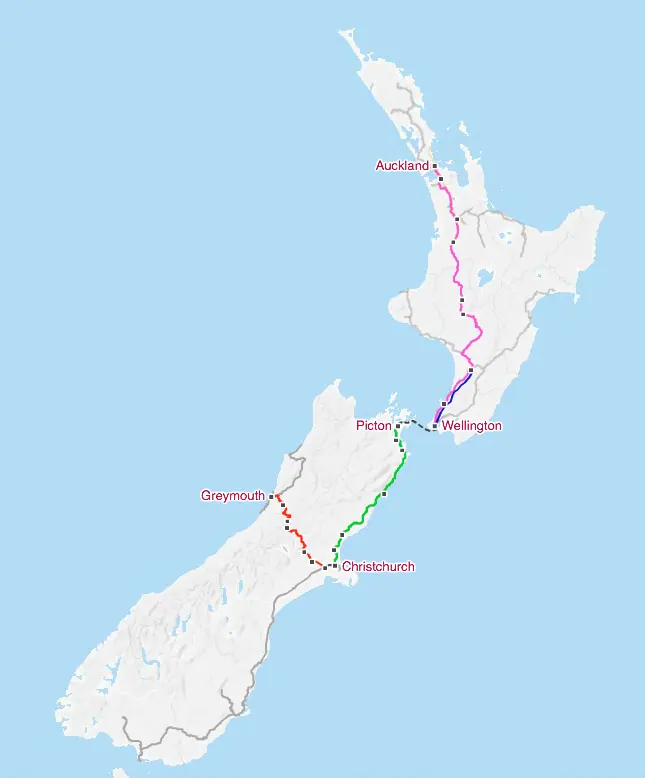 Chapter 25Utility networksAn electricity cable, telephone circuit, water main or gas pipe can be drawn perfectly on a map and still be a poor network record. Operators need to know where it is, but they also need to know what it connects to, which equipmenRead chapter →
 Chapter 26Conservation and environmentIn late 1985 Mary McEwen encountered GIS while ecological region and district boundaries were being digitised and DSIR’s Science Mapping Unit was beginning to use an Intergraph system. The work sat inside a longer conservation traRead chapter →
 Chapter 27Health population and placeA disease case can be put on a map as soon as it has a usable location, yet a case count alone is only a partial measure of disease. Ten cases in a suburb of 2,000 people mean something different from ten cases in a city of 100,00Read chapter →
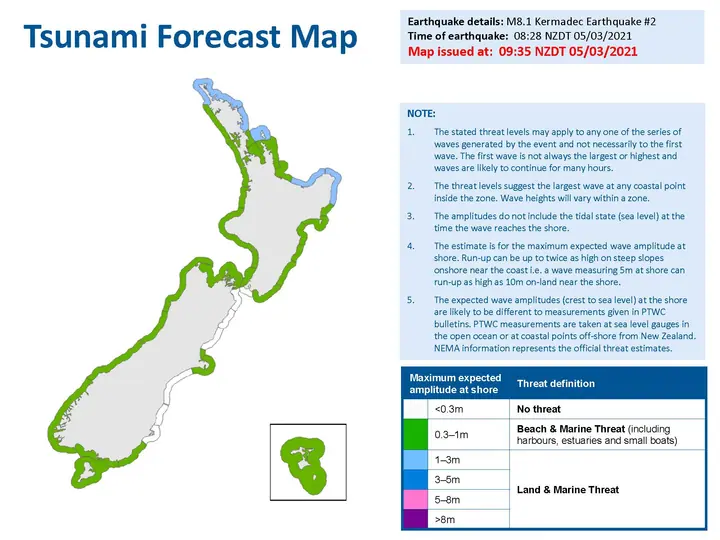 Chapter 28Policing and public safetyBy the mid-1990s New Zealand Police was rebuilding the way it recorded and retrieved operational information. The important geographic decision was made inside that wider records environment. A later practitioner account by Andy GRead chapter →
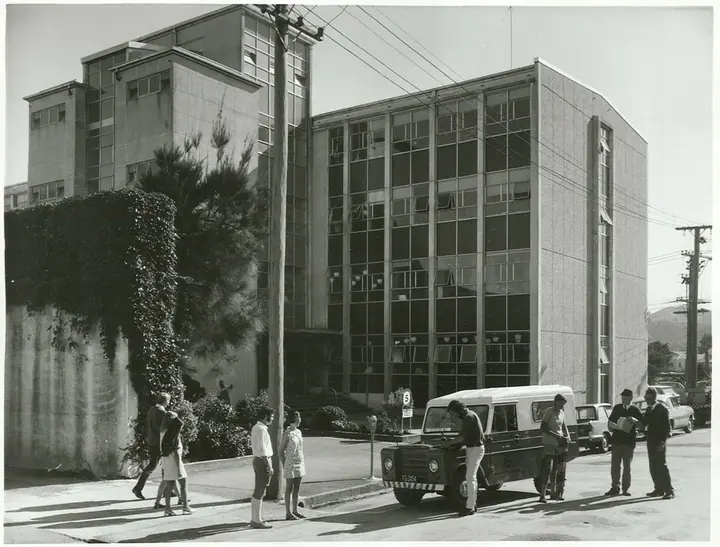 Chapter 29The GIS professionFor much of the period in which digital mapping developed in New Zealand, there was no settled occupation called a GIS professional. People arrived from surveying, cartography, photogrammetry, geography, planning, forestry, computRead chapter →
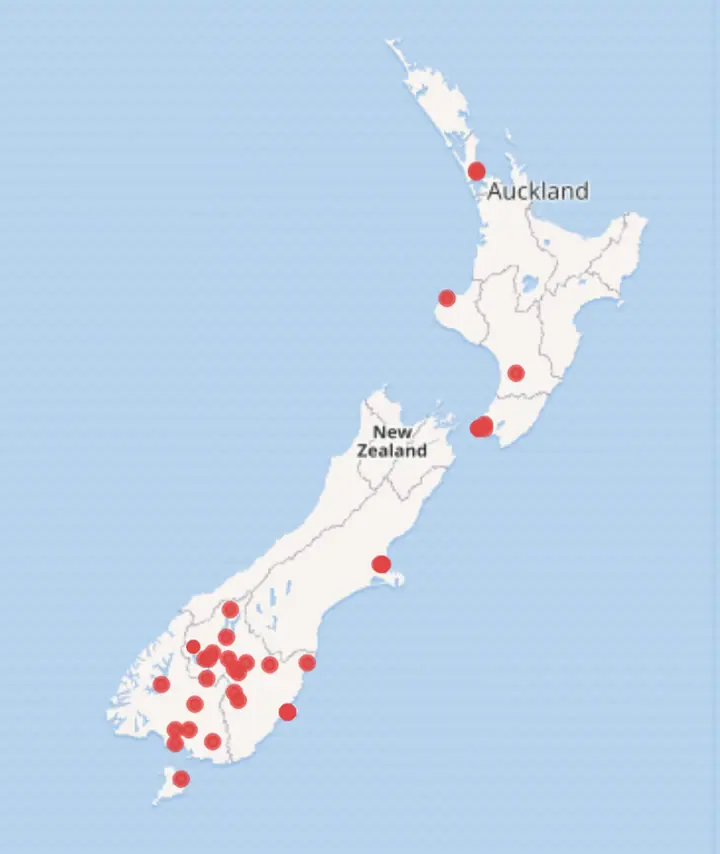 Chapter 30Early web mappingAt the end of the 1990s, a geographic information system could still be a very literal place. In New Zealand Police, the early analyst GIS was installed on customised workstations at individual sites. Crime and mapping data were lRead chapter →
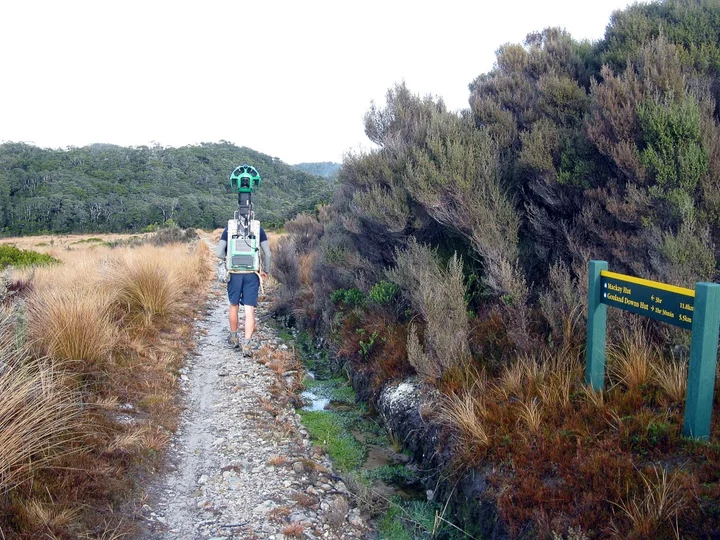 Chapter 31Google Maps and EarthGoogle Maps launched its fully localised New Zealand service in December 2007, joining earlier interactive mapping services. New Zealand organisations had already spent most of a decade moving spatial information into web browsersRead chapter →
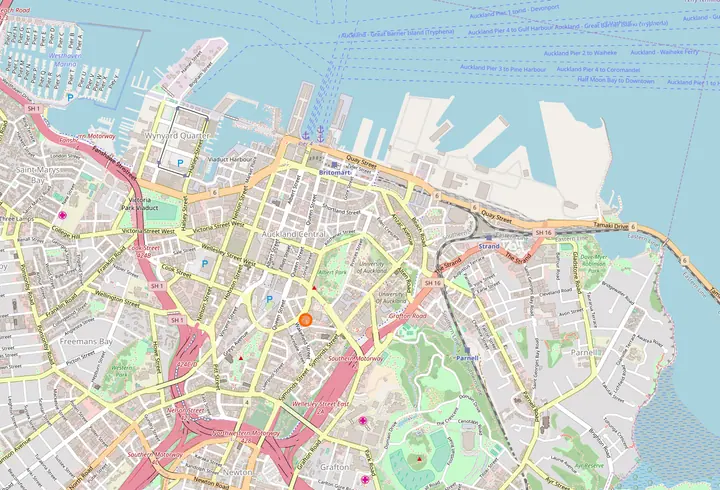 Chapter 32Open source GISNew Zealand organisations adopted open-source GIS software gradually. Early operational uses included spatial databases, web servers and custom applications. By the middle of the 2000s, organisations were assembling systems from cRead chapter →
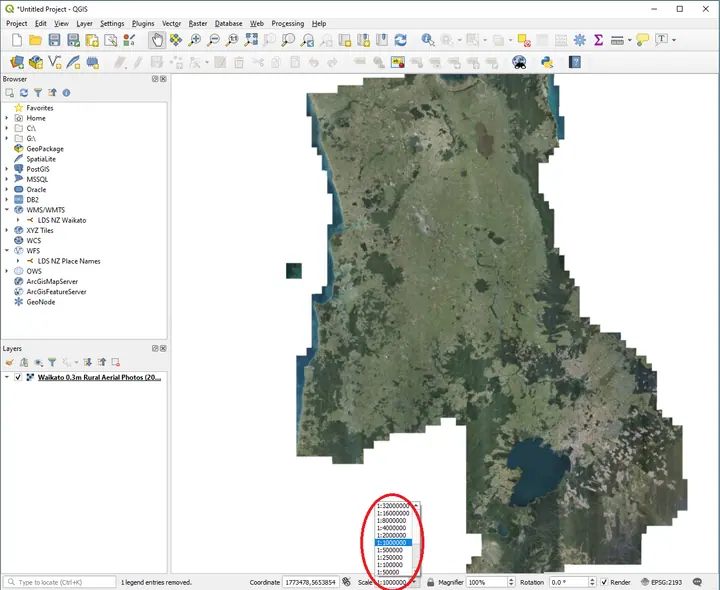 Chapter 33Open spatial dataBy the early 2000s New Zealanders could already see a surprising amount of geographic information on the web. Statistics New Zealand had a free Census WebMap by March 2002. Councils were putting property and planning information iRead chapter →Chapter 34GIS in the fieldFor most of the history of GIS, the computer stayed inside. The field worker went outside. That division shaped how information moved. Someone might leave the office with a paper map, printed aerial photograph, notebook, inspectioRead chapter →Chapter 35Mapping applicationsFor much of GIS history, using GIS meant seeing GIS. A specialist sat at a workstation surrounded by layers, toolbars, coordinate systems and query functions. When GIS moved into browsers around the turn of the century, much of thRead chapter →
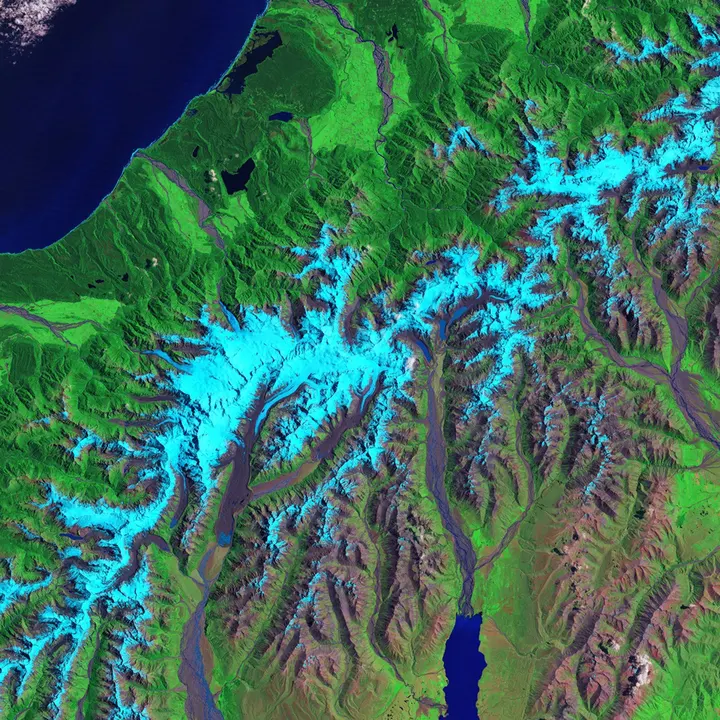 Chapter 36Satellite observationsIn October 1975 a New Zealand Landsat II scene entered a computing world that looked nothing like modern GIS. The DSIR Physics and Engineering Laboratory programme handled satellite data through computer-compatible tapes, IBM mainRead chapter →
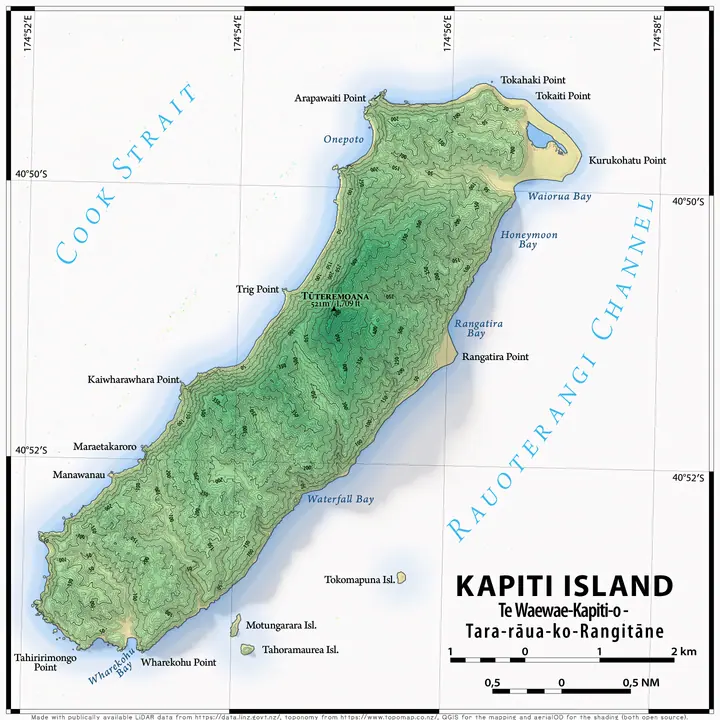 Chapter 37LiDAR mappingFor four days in July 2003, an aircraft crossed Christchurch and part of the adjoining Waimakariri River corridor carrying a laser scanner. Christchurch City Council commissioned the survey, flown by AAM GeoScan from 6 to 9 July. Read chapter →
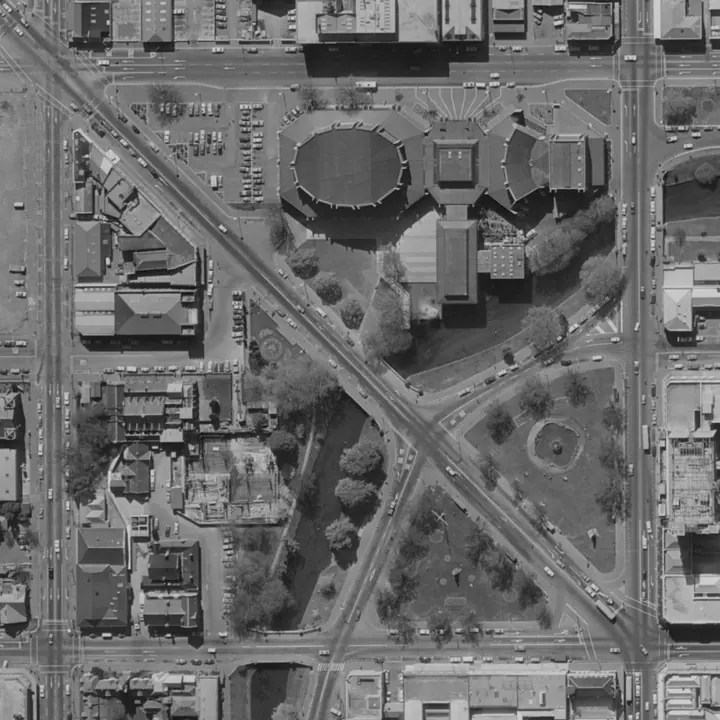 Chapter 38Drone mappingThe August 2012 Te Maari eruption left hundreds of ballistic impact craters across part of the Tongariro landscape. New Zealand Aerial Mapping flew LiDAR and aerial imagery over the area in November that year, producing a broad reRead chapter →
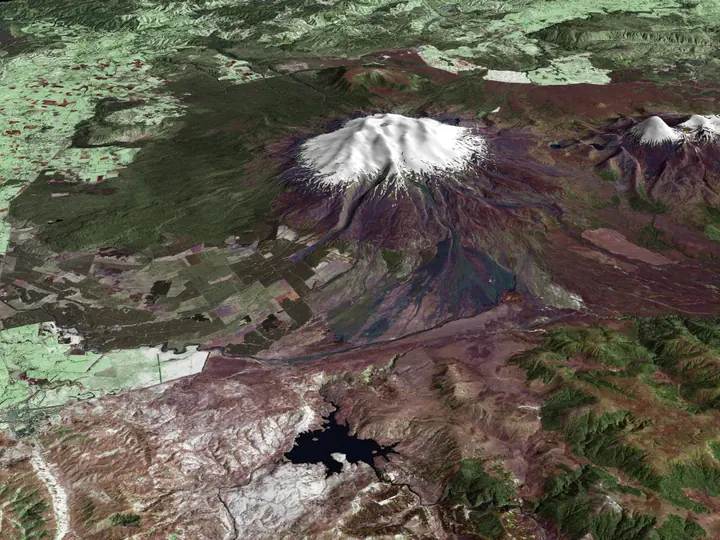 Chapter 39Mapping in 3DFor much of GIS history, height was present without making GIS fully three-dimensional. Contours carried elevation across topographic maps. Digital elevation models stored a height value across a surface. Surveyors measured levelsRead chapter →Chapter 40Enterprise GISBy the late 1990s New Zealand organisations had already proved that GIS could do useful work. That success created a new problem: GIS multiplied. Councils could maintain property and infrastructure layers, government departments cRead chapter →
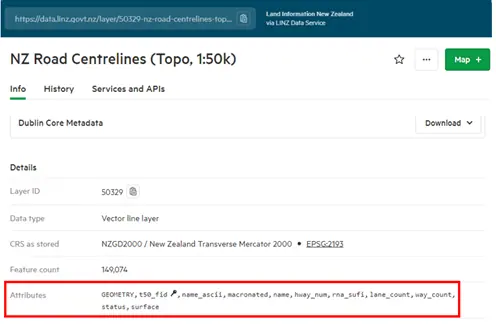 Chapter 41Spatial services and the cloudBy the late 2000s New Zealand GIS was already comfortable with servers. Councils, government departments, utilities and research organisations had spent years moving spatial data into shared databases and publishing maps through iRead chapter →
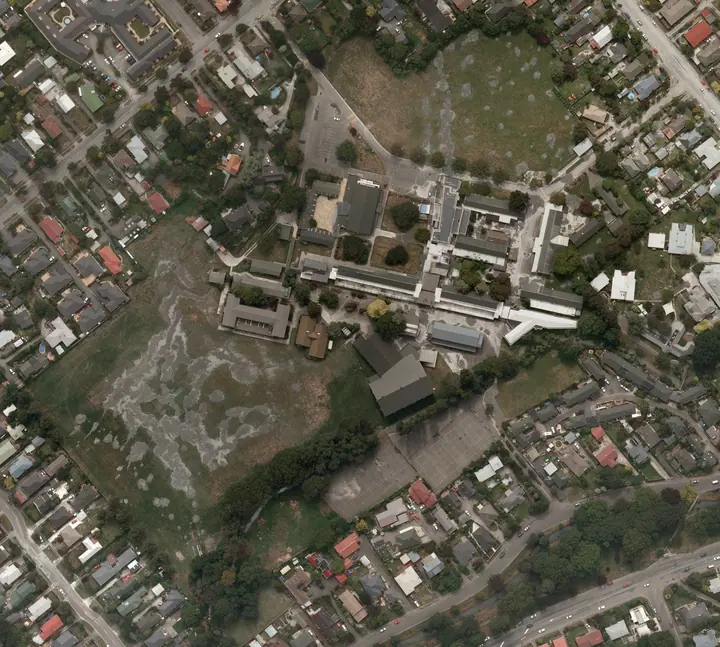 Chapter 42Disaster response and live mappingFor much of GIS history, a map could be out of date without anyone noticing for a while. A road changed, a subdivision appeared, a river shifted or a new building was added, and the database caught up later. Emergency mapping makeRead chapter →
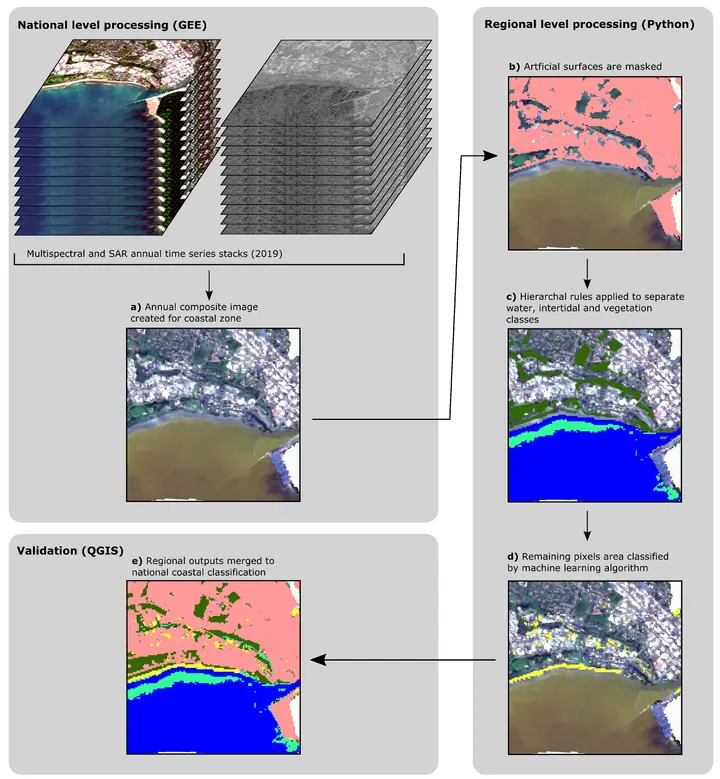 Chapter 43GIS automationGIS has always involved repetition. A dataset arrives, its coordinate system is checked, unwanted records are removed, fields are joined, geometry is processed, a map is produced, and the result is exported. Early practitioners coRead chapter →
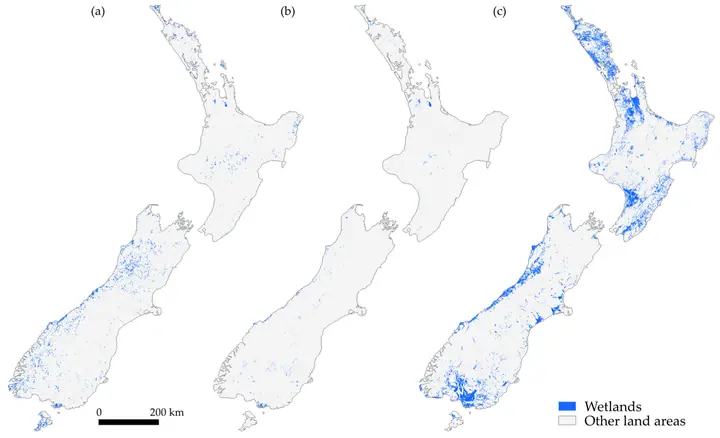 Chapter 44GIS and AI in 2025By 31 December 2025, a New Zealand geospatial practitioner could spend much of a working day dealing with geography without opening what an earlier generation would have recognised as a conventional GIS. Data could arrive through Read chapter →